Latest News
Consolidation vs. Creation: The Counter-Narrative in Professional Services
http://axiomaticdata.com/blogPosts/consolidation-vs-creation-the-counter-narrative-in-professional-services
This month's Axiomatic Form 5500 data (November 2025) provides a necessary counterpoint to this consensus, pointing to a parallel trend of small firm creation. While consolidation certainly persists, the F5500 filings, which track the formation of new employee benefit plans, reveal a hidden boom in new professional entities.
Our data shows the largest net increases in active companies this month across three key sectors:

The data suggests a strong element of fragmentation is offsetting the merger activity. Professionals may be seeking greater autonomy, enabled by technology (like AI legal tech and cloud-based practice management) that lowers the barrier to starting an independent firm.
Nuancing the Trends
The chart below, which tracks the total number of active companies (Form 5500 filers) over the past two years, adds necessary nuance:
We see a divergence in professional services: Lawyers and Dentists show sustained net growth in company count, proving that formation is beating consolidation. For Physicians, the long-term trend aligns with media reports on consolidation (e.g., Becker's ASC Review's report that nearly half of U.S. physicians were hospital employees by 2024), showing a net decline of approximately 1,600 entities since late 2023. Nevertheless, the addition of 338 net new physician companies in November 2025 suggests a recent, albeit small, revival of independent practice activity.

Investment Thesis and Data Utility
This duality—consolidation coexisting with creation—presents a bifurcated investment opportunity. While consolidation targets large-scale M&A, the fragmentation trend points toward reliable investment in the "picks and shovels" that service this burgeoning base of small firms (e.g., specialized software, cloud-based services, and focused suppliers).
Axiomatic’s Form 5500 data is unique because it offers a ground-truth, bottom-up view of company formation and employment, directly tracking the establishment of benefit plans. This level of granular, non-survey-based insight allows investors to spot nascent trends.
Top 5 leading auditors of Pension plans in the U.S.
http://axiomaticdata.com/blogPosts/Top-5-leading-auditors-in-the-US

Axiomatic Data has over 10 years of history and extracts all relevant data from Form 5500 filings.
Top 5 leading auditors of Pension plans in California
http://axiomaticdata.com/blogPosts/top-5-leading-auditors-california
- Armanino
- CLA (CliftonLarsonAllen)
- Holthouse Carlin & Van Trigt Fort Worth
- Pensionassurance
- Moss Adams

Axiomatic Data has over 10 years of history and extracts all relevant data from Form 5500 filings.
Examining A Nudge: Has Auto-Enrollment in Retirement Plans Increased Over Time?
http://axiomaticdata.com/blogPosts/examining-a-nudge--has-auto-enrollment-in-retirement-plans-increased-over-time
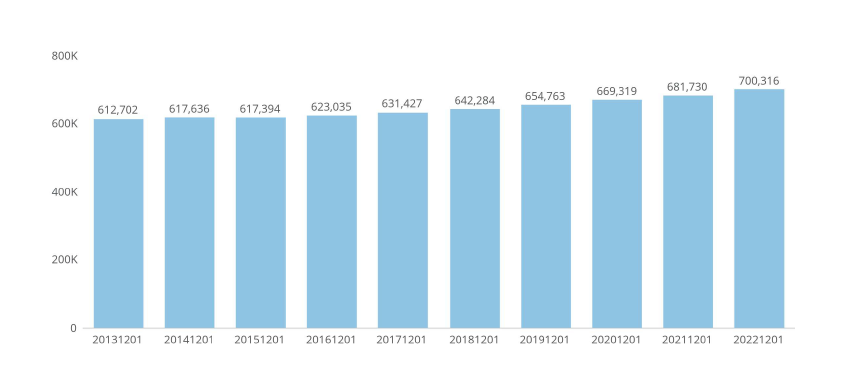
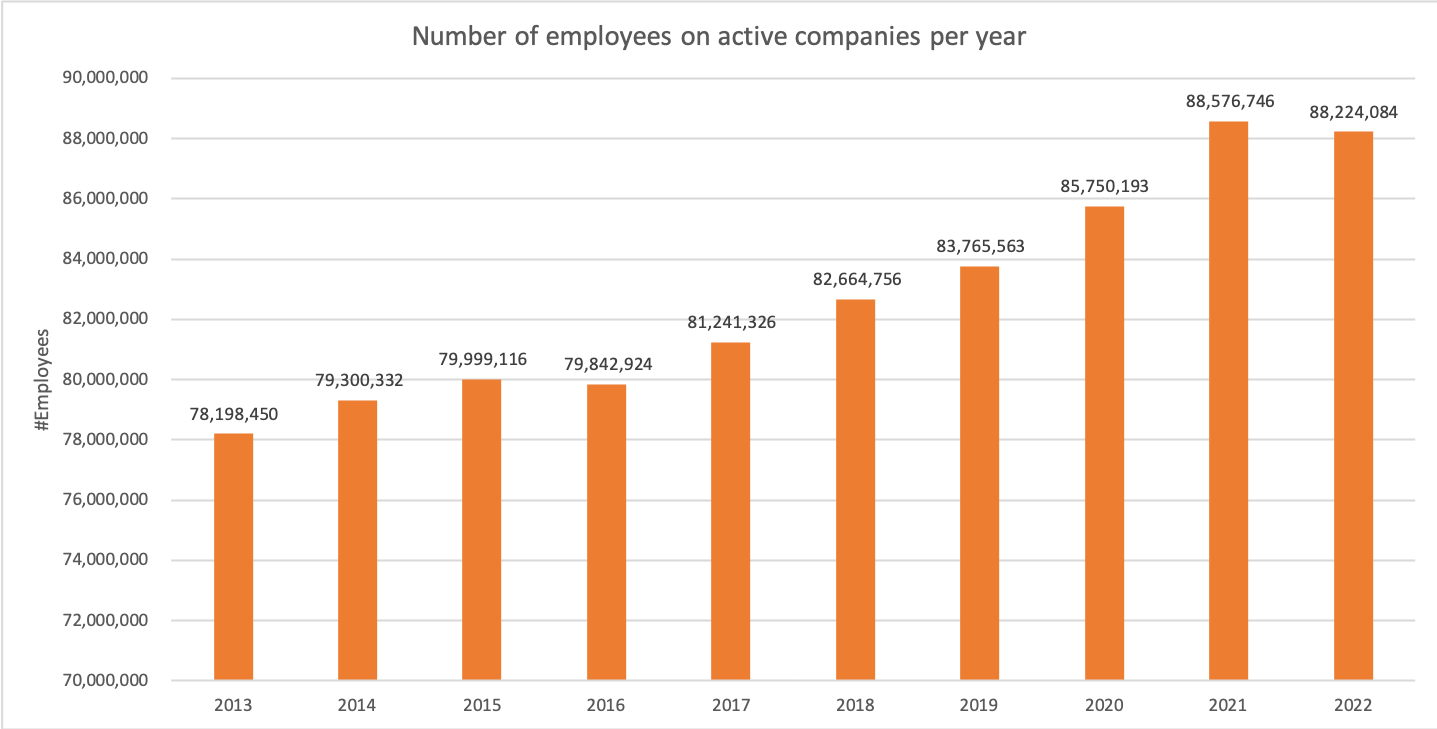
Auto-enrollment in retirement plans is a prime example of a nudge in practice. Traditional economic theory would suggest that if individuals understand the benefits of saving for retirement, they would opt into retirement plans that best suit their needs. However, in reality, many individuals do not enroll in such plans due to a variety of reasons, including inertia, procrastination, or the complexity and overwhelming nature of choice. Chart 1 illustrates the number of companies offering retirement plans to their employees from 2013-2022.
Chart 1: Number of US Companies Offering a Retirement Plan Benefit, 2013-2022
By automatically enrolling employees into retirement plans, employers effectively change the default option. Instead of the default being "not enrolled", it becomes "enrolled". Employees can still opt-out if they choose to, so their freedom of choice isn't restricted. However, the shift in the default takes advantage of the inertia that might have previously prevented them from enrolling. Most people tend to stick with default options because it's often perceived as the suggested or easiest course of action. Thus, by making enrollment the default, it's more likely that employees will start saving for retirement without any active decision on their part.The power of this nudge lies in its subtlety. By merely changing the starting point or default state, auto-enrollment can lead to significant increases in retirement savings rates. It leverages behavioral insights about human nature, particularly our tendency towards inertia and the status quo bias, to promote better long-term financial decision-making.
So what does the data say about this particular nudge? Using Form 5500 filings going back to 2013, Axiomatic Data looked at the prevalence of auto enroll among US companies. Form 5500 series is a reporting and disclosure tool used to satisfy annual reporting requirements by public and private companies in the U.S. for employee benefit plans under ERISA and the Internal Revenue Code.
Form 5500 was jointly developed by the Department of Labor (DOL), the Internal Revenue Service (IRS), and the Pension Benefit Guaranty Corporation (PBGC). Employee benefit plans include welfare benefits such as medical, dental, vision, etc. and retirement benefits such as 401Ks and others.
Chart 2 shows that across all Form 5500 filing companies, auto-enroll has increased from 4% of plans in 2013 to 17% of plans in 2022. This covers a universe of approximately 700,000 US companies, both public and private.
Chart 2: Percentage of pension plans with auto-enroll - all Form 5500 filers
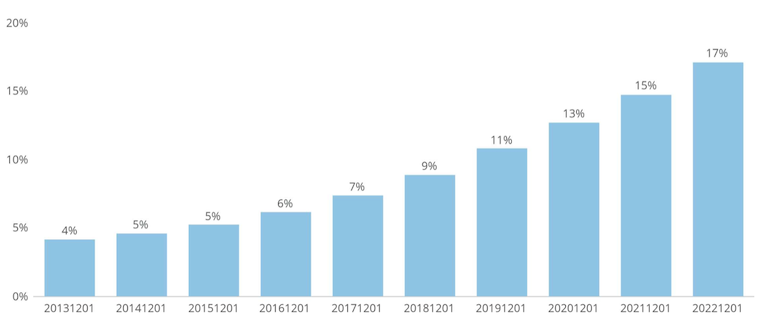
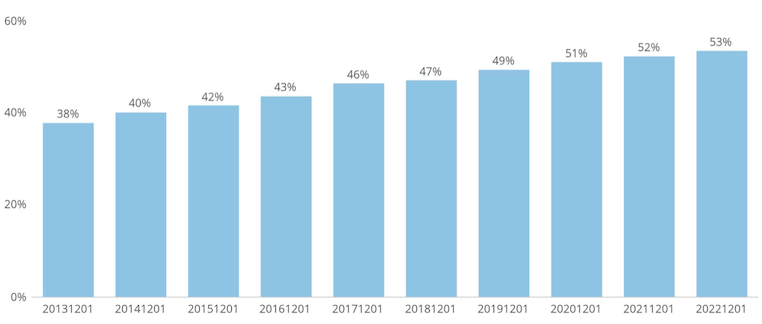
Chart 3 shows similar data for the Russell 3000, where auto-enroll has grown in prevalence from 38% in 2013 to 53% in 2022.
Chart 3: Percentage of pension plans with auto-enroll - Russell 3000
This data clearly shows that auto enrollment is a growing feature of retirement plans offered by US companies of all sizes, from small private companies to companies included in the Russell 3000. The next question we asked was if having auto enrollment noticeably increased retirement plan participation. Even if an employee is automatically enrolled, they can choose to opt out.
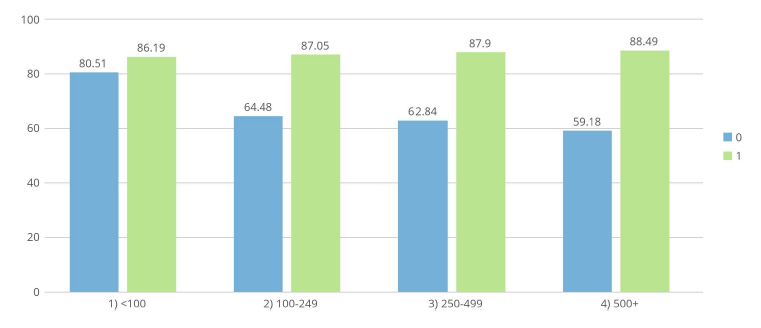
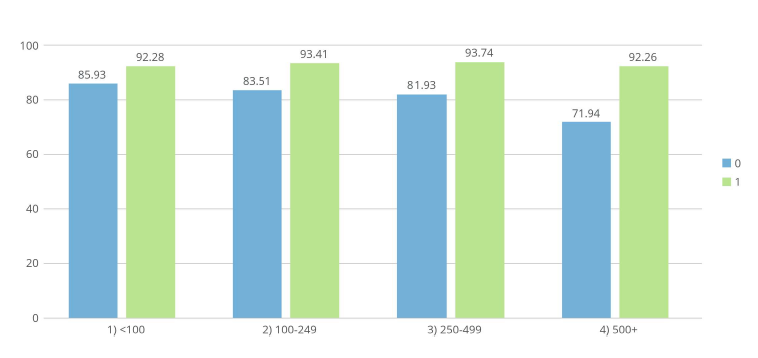
In every case, automatic enrollment leads to higher participation rates. In Chart 4 we show participation rates across the entire universe of filing companies broken down by company size. The blue bars represent the participation rate among companies that do not have auto enrollment; the green bars represent companies that do have automatic enrollment. The chart breaks down the company universe by size, from less than 100 employees on the far left to companies with greater than 500 employees on the far right. The larger the company with an automatic enrollment feature, the higher the plan participation rate.
Chart 4: Participation Rates by Employee Count - Without Auto Enrollment vs With Auto Enrollment, all Filers
For Russell 3000 companies seen in Chart 5, the data is similar. The larger the company is in terms of number of employees, the greater the difference in participation if the company has auto-enrollment.
Chart 5: Participation Rates by Employee Count - Without Auto Enrollment vs With Autoenrollment, Russell 3000
Conclusion
There’s been a significant amount of research conducted since Nudge was published and some of this research has exposed some nudges as ineffective. The data proves that auto-enrollment has noticeably increased participation rates in employee sponsored retirement plans, which will ultimately benefit participants in the future.
YoY Industry growth metrics From Form 5500 Filings
http://axiomaticdata.com/blogPosts/yoy-industry-growth-metrics-from-form-5500-filings
The November 2022 US Bureau of Labor Statistics Monthly Labor Review titled Projections overview and highlights 2021-2031 forecasted that:
“Employment and real output are projected to grow during the 2021–31 decade, reflecting both cyclical recovery from the 2020 coronavirus disease 2019 (COVID-19) pandemic-induced recession, and structural growth. About one-fourth of the population will be age 65 or older in 2031, contributing to slow projected growth in the labor force and a continued decline in the labor force participation rate. The aging population is also expected to continue to drive strong demand for a variety of healthcare services, with 2.6 million jobs projected to be added in the healthcare and social assistance sector through 2031.”
This paper examines year-over-year changes in data gleaned from Form 5500 filings that confirms or conflicts with recent projections made by the Bureau of Labor Statistics. From the BLS projections one could surmise that:
- Industries and businesses that were most negatively affected by the COVID-19 pandemic should be showing signs of recovery and growth in the 2020-2021 period.
- Given the ageing population thesis, which has been in effect for some time, healthcare services and social assistance businesses should be growing in employment and business creation at a faster rate than other sectors.
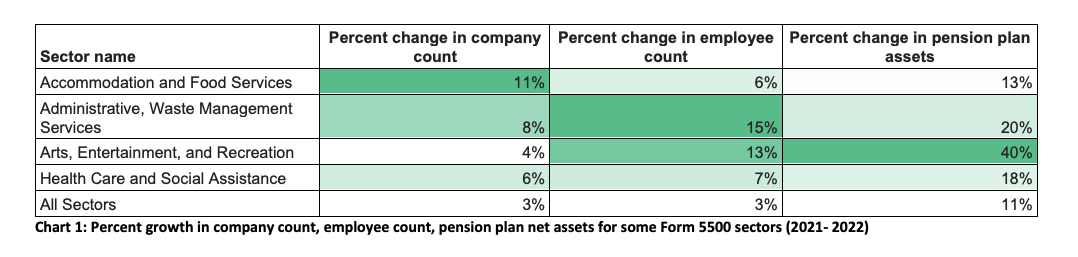
We see from 2021 Form 5500 filings data (Chart 1 below) that while Accommodation and Food Services sector grew most rapidly between Dec 2021 – Dec 2022, there was moderate growth in Health Care and Social Assistance.
Post-pandemic, the recovery and growth in employment for the service-providing industries and occupations that lost jobs during the pandemic constitutes a large component of the YoY growth. For example, industries within the leisure and hospitality sectors were the fastest growing sector as consumption in food services and accommodation returned to pre-pandemic patterns.
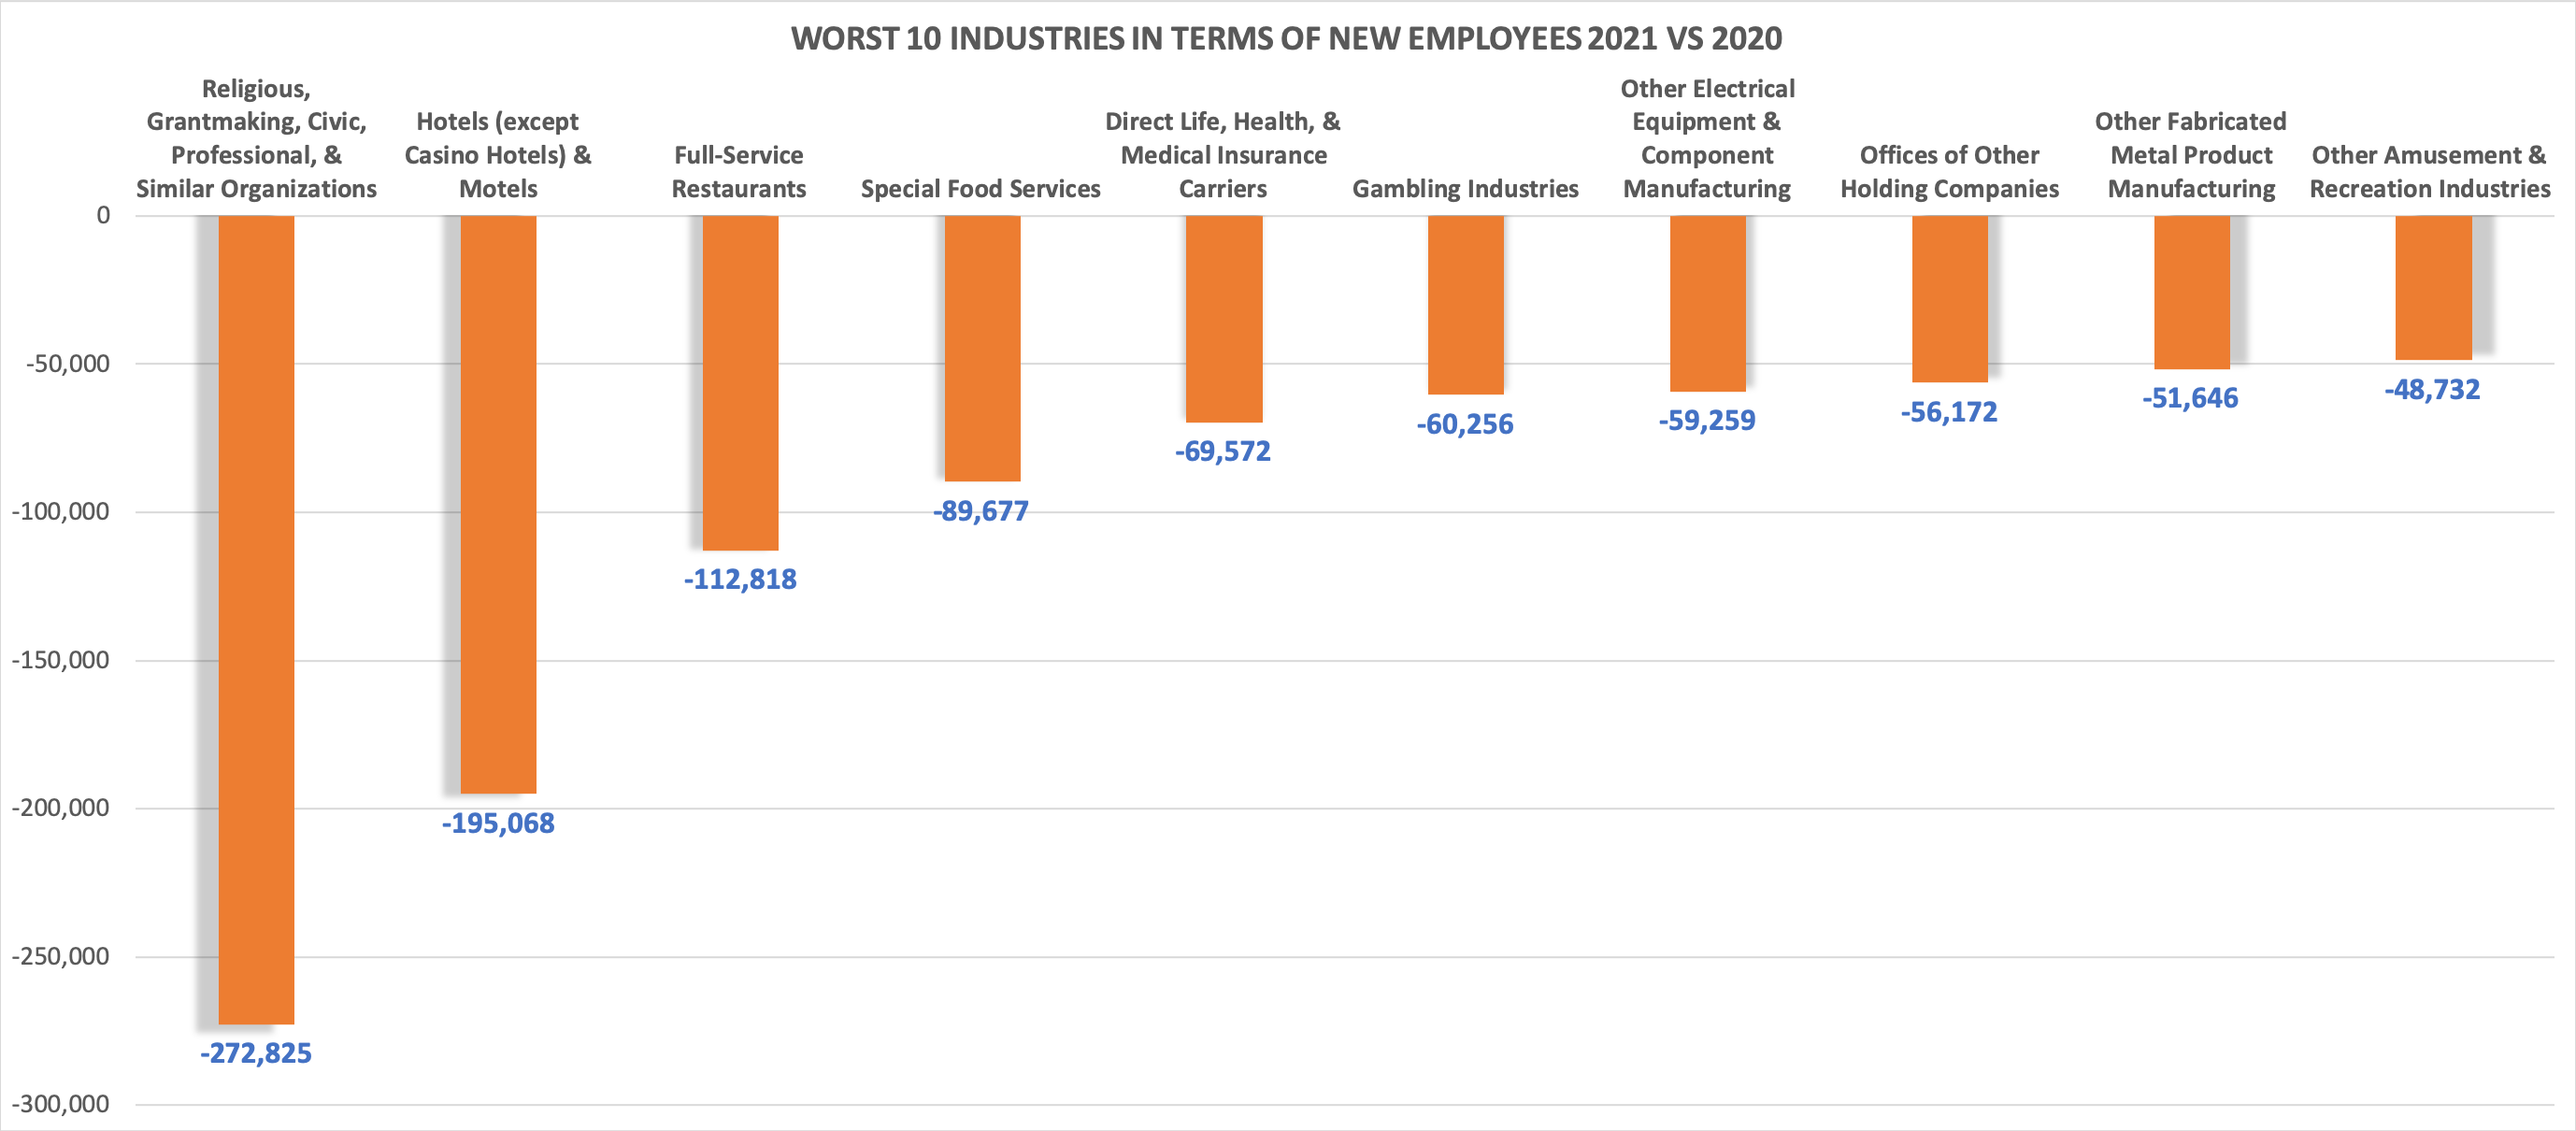
Looking at the percentage growth in employee count by Form 5500 sub-sectors, chart 2 shows that changing consumer preferences during the pandemic has led to strong YoY growth in service-providing sub-sectors such as Amusement, Gambling and Recreation industries, Sporting Goods, Hobby, Book and Music Stores, and Courier and Messengers services post-pandemic. The growth of employee count in Amusement Gambling, and Recreation industries is 16%, indicating that many venues that had closed due to Covid have reopened and are close to business as usual.
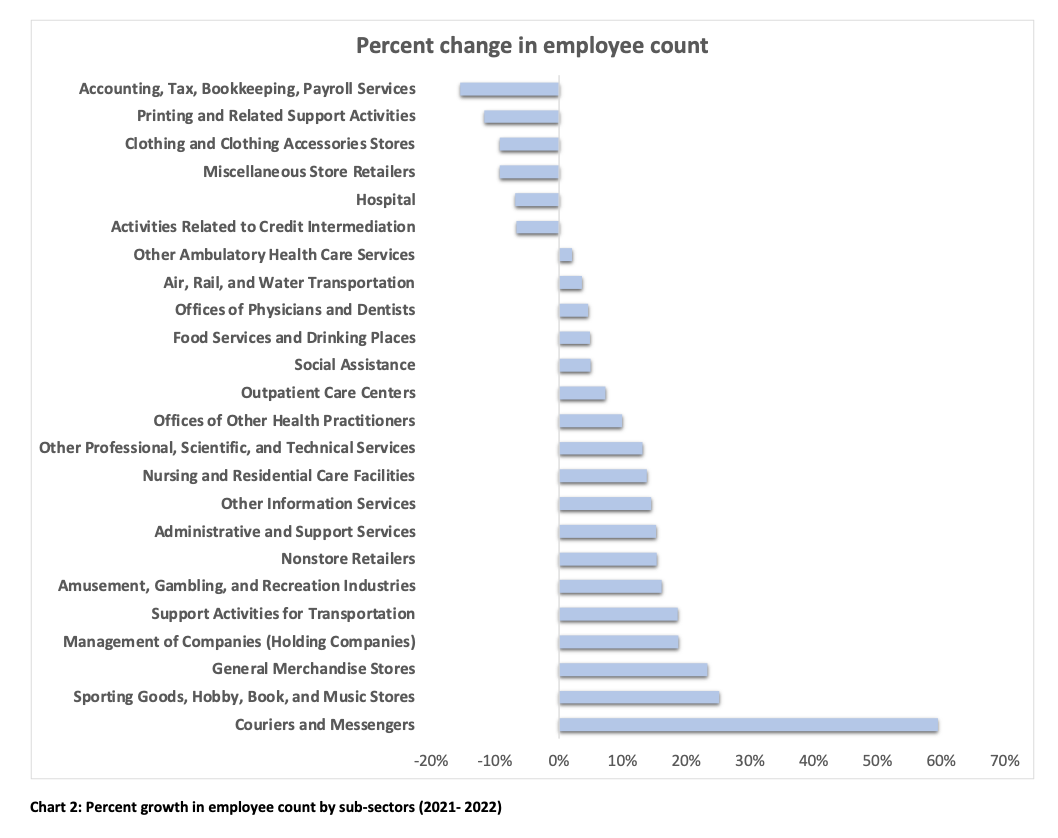
Based on the aging population thesis, we see that employee count in Outpatient Care Services grew by 7% while Nursing and Residential Care Facilities grew by14% respectively. The YoY increase in number of employees in following sub-sectors indicates demand spurred by an ageing population:
- Other Ambulatory Health Care Services
- Social Assistance
- Outpatient Care Centers
- Offices of other Health Practitioners
- Nursing and Residential Care Facilities
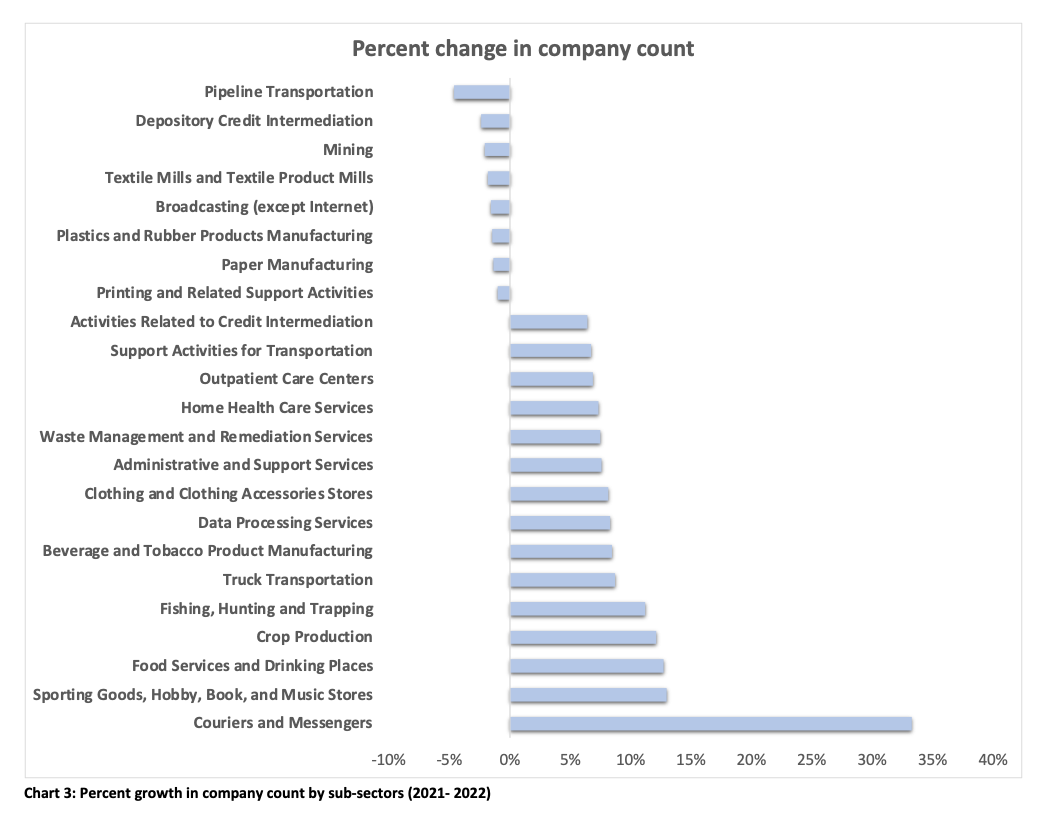
Chart 3 shows the percentage change in company counts by Form 5500 sub-sectors. It is evident that the nature of the pandemic related economic changes and activities increased structural demand for some occupations leading to a long-term structural growth for these sub-sectors. For example, structural shifts in consumer demand for home delivered goods resulted in the largest YoY growth of 33% in company count and 60% growth in employee count for Couriers and Messenger services.
In contrast, cyclical recovery in demand for Food and Hospitality sectors with more people starting to eat out at restaurants post-pandemic, led to a 15% growth in company count and a modest 5% growth in employee count for the Food and Drinking places, one of the most impacted sub-sectors during Covid-19.
Contact info@axiomaticdata.com for more information about how your company can leverage Form 5500 data.
Accounting Intelligence and Prospecting From Form 5500 Filings
http://axiomaticdata.com/blogPosts/accounting-intelligence-and-prospecting-from-form-5500-filings
In addition to providing company-level data, Axiomatic Data provides plan-level data as a data product. Common use cases for the plan level data include:
- Identifying potential clients for financial planning or insurance services.
- Targeting companies that require employee benefits-related services.
- Plan benchmarking: Employers and plan sponsors can compare their plans to industry averages and make adjustments as needed.
Having worked with Form 5500 data for over 10 years, Axiomatic Data transforms the raw Form 5500 filings and schedules into ready-to-consume data products. Axiomatic Data aggregates, harmonizes, and normalizes several million Form 5500 filings each year to create an accurate and robust database that serves multiple use cases. Additionally, the Form 5500 experts at Axiomatic Data are available for custom Form 5500 analytics requests and needs.
Form 5500 Plan Auditors
Generally, employee benefit plans with 100 or more participants (those that file a Schedule H) must include an audit report with Form 5500. If the total participant count as of the first day of the plan year is less than 100, a company generally doesn’t need to include an audit report with its Form 5500.
On the Form 5500 filing, the name of the accounting firm along with its Employer Identification Number (EIN) is included. This information can be leveraged for a variety of use cases:
- Competitive intelligence for accounting firms to identify potential clients and clients held by competitors (not only is the accounting firm identified but the size of the company filing the Form 5500).
- Due diligence for a company looking to engage with a new accounting firm (identify the accounting firms working with peers in its industry or region).
- Holistic view of the accounting industry to identify which accounting firms are growing and shrinking.
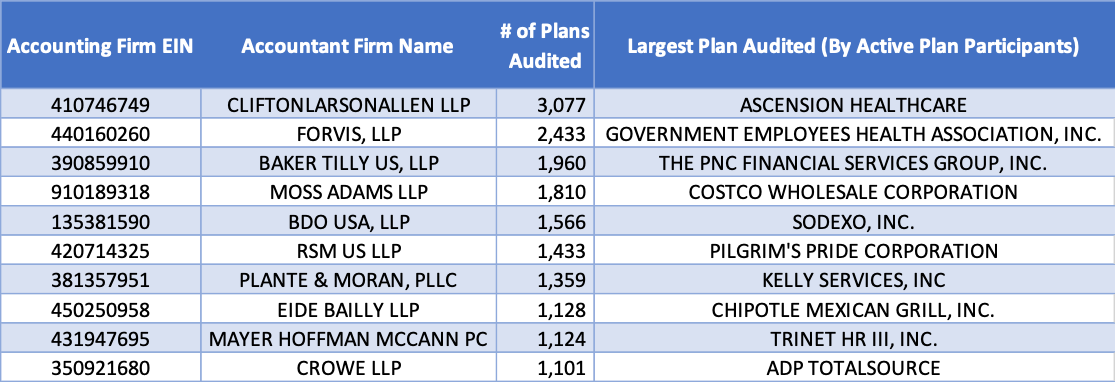
The above figure displays the accounting firms that have audited the most Form 5500 filings during the prior year. CliftonLarsonAllen, the 8th largest accounting firm in the U.S., audited nearly 4% of the total audited Form 5500 Filings in 2022. Note that this table focused purely on the number of filings audited rather than the size of the companies filing, which is why none of the traditional “Big 4” accounting firms are listed. However, total assets in a Form 5500 benefit plan along with employee participation count are available in the Axiomatic Data plan level dataset.
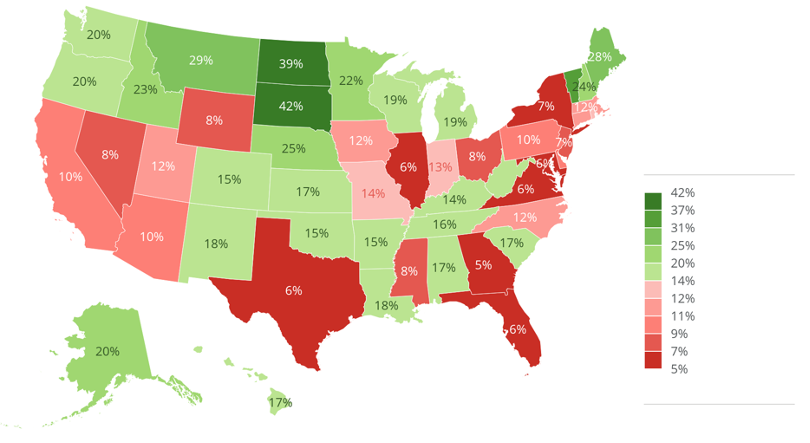
The above figure examines the market share by the most used Form 5500 accounting auditor for each state. Not surprising, states with smaller populations (such as North Dakota and South Dakota) tend to have accounting firms with higher market concentrations.
Contact info@axiomaticdata.com for more information about how your company can leverage Form 5500 data.
Comparison of 2021 and 2022 Company Data from Form 5500 Data
http://axiomaticdata.com/blogPosts/comparison-of-2021-and-2022-company-data-from-form-5500-data
Number of Active Companies
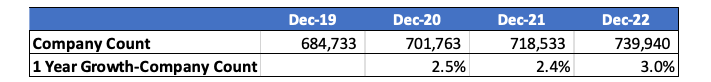
Below is a table displaying the number of active companies by year for the last four years. The most recent year has a slightly higher growth rate which may be indicative of a return of business activity post Pandemic.
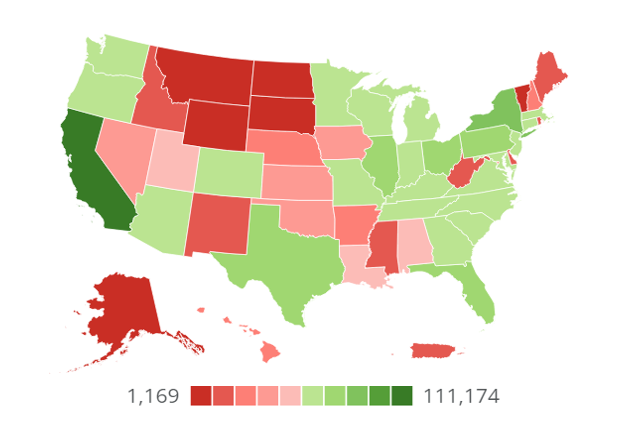
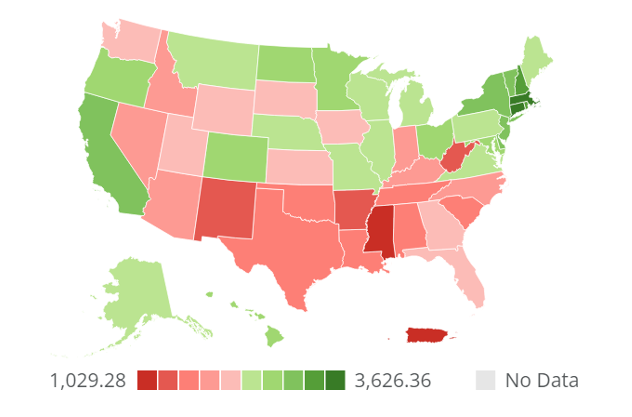
As Form 5500 data provides valuable firmographics such as official company name, address, industry classification, etc., we are able to compare changes across these metrics over time. Filing a Form 5500 itself is a signal of financial strength and stability compared to companies that do not file Form 5500s. While there are strong and profitable companies that may never file a Form 5500, setting up an employer sponsored retirement plan covered under ERISA is a sign of strength as setting up a plan is a nontrivial commitment. Below is a chart depicting the distribution of companies across the United States. Not surprising, California has the most companies with over 111,000.
Examining the same chart but on a per-capita-basis (# of companies per 1M residents), we notice a high distribution of companies per state resident in the Northeast U.S., while the Southeast has a lower distribution per capita. Particularly, Massachusetts has the highest number of companies with 3626 companies per 1M residents, while Mississippi has the lowest number of companies per capita, 1029, which is more than 3.5X lower than Massachusetts.
U.S. County Comparison
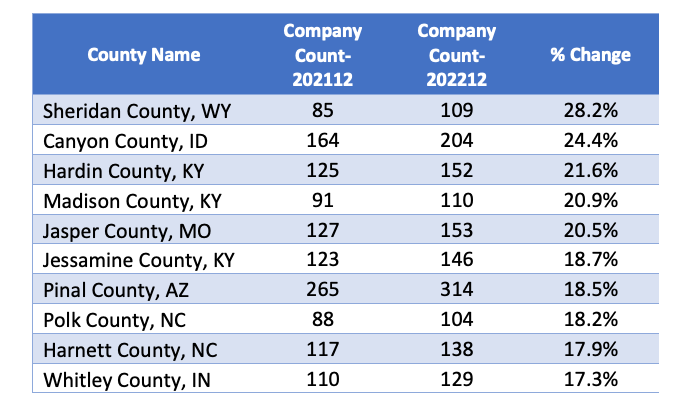
Below is a table comparing counties with the largest % increase in companies from December 2021 to December 2022. This table only includes counties with more than 100 active companies in the Axiomatic Data database. These increases can be a sign of economic strength in the region. It is noteworthy that Kentucky had three of the counties within the top ten for company growth rate.
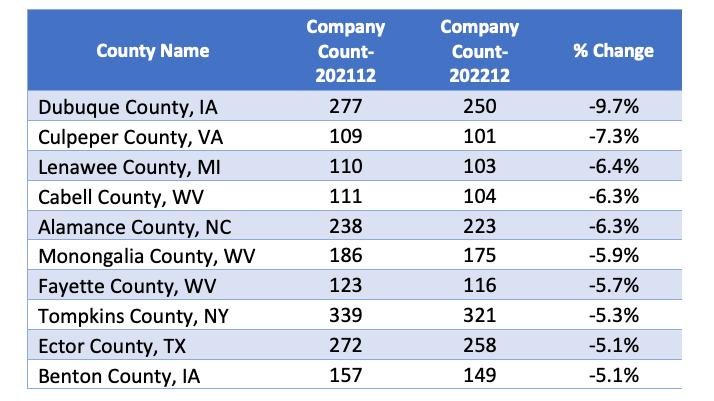
On the other hand, the chart below lists counties with the largest % decrease in companies from 202112 to 202212. Overall, Dubuque County had the largest drop of nearly 10%. The state of West Virginia had three of the top ten counties on the list indicating signs of potential economic weakness in the area.
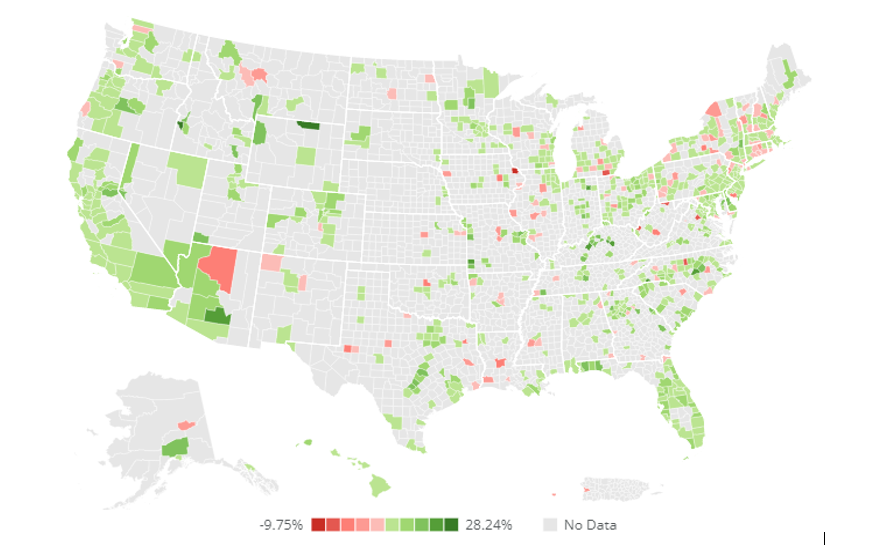
The map of the U.S. below shows company growth rates by U.S. county for all counties in the U.S. with more than 100 companies in the Axiomatic Data database.
Data sample: Please visit https://www.axiomaticdata.com/samples/ for a data sample along with data dictionary. Select the “Private Company Prospecting Sample” for either Rhode Island or South Dakota.
Download as PDF: Axiomatic Data Year Over Year Comparison Company Count
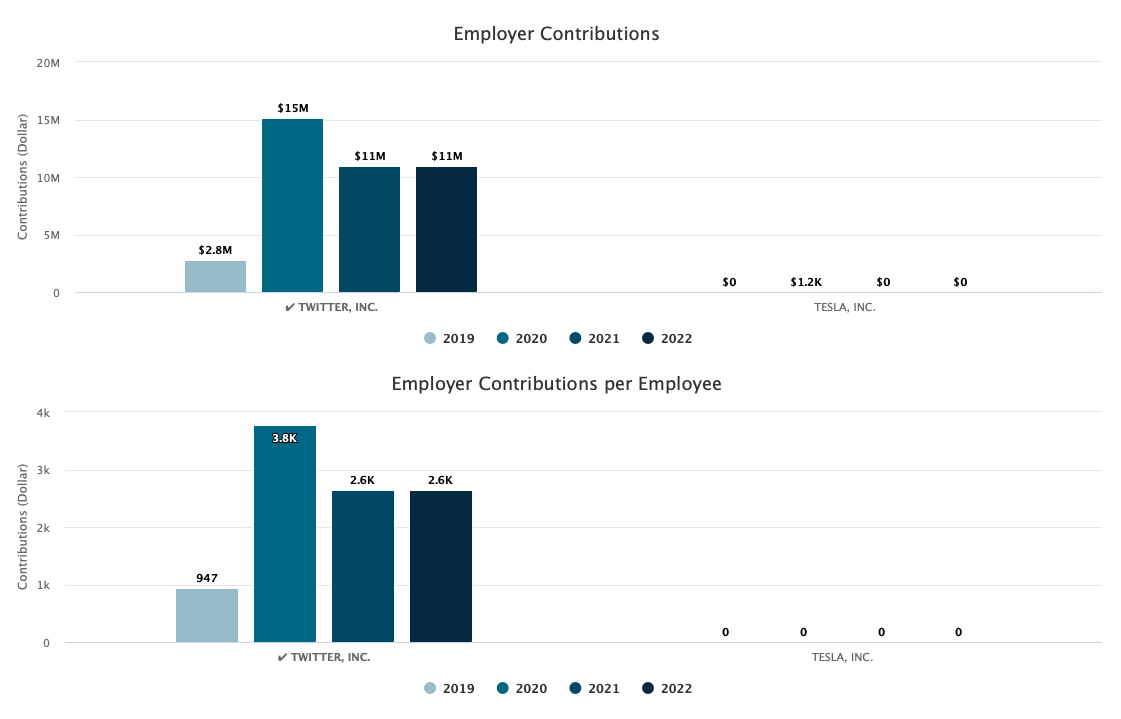
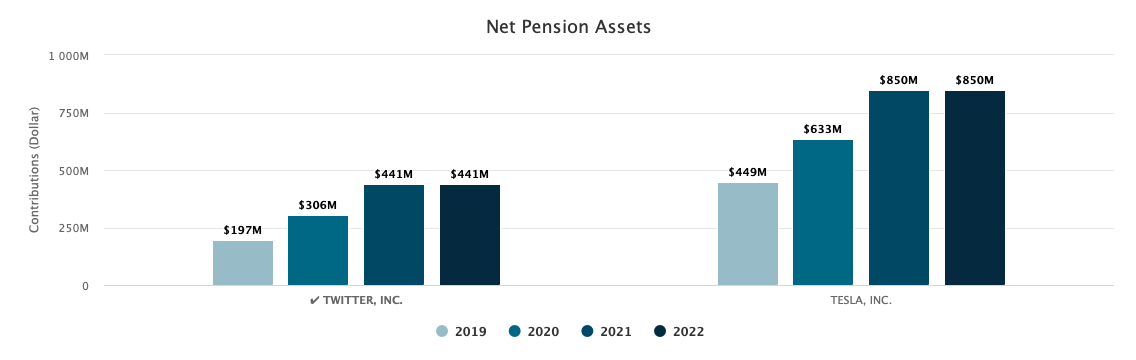
Benefit Surprises - A quick comparison of pension benefits at Twitter and Tesla
http://axiomaticdata.com/blogPosts/benefit-surprises---a-quick-comparison-of-pension-benefits-at-twitter-and-tesla
Tesla has been around longer than Twitter, filing its first Form 5500 18 years ago while Twiter first filed 15 years ago.
Tesla employed five times as many people as Twitter, before the layoffs that are in progress now.
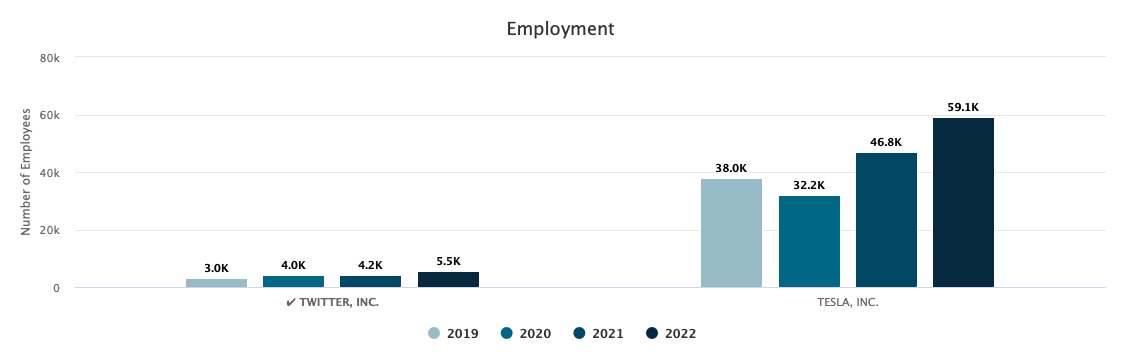
But total pension plan contributions are only twice as large at Tesla. (2022 numbers below are estimates.)
That’s because until this year TSLA did not match - employer contributions to employee pension plans had been zero since the company started.
So despite having 10 times as many people and being an older company by three years, Net Pension Assets at Tesla are not even double those of Twitter.
Tesla did start matching 50% of each employees' contributions to the Tesla Inc. 401(k) Plan up to a maximum of 6% of the employee's eligible compensation, capped at $3,000.¹
Axiomatic Data ESG Social metrics
http://axiomaticdata.com/blogPosts/axiomatic-data-esg-social-metrics
Axiomatic has built a consistent, comparable framework with material and auditable ESG factors, extracted from publicly available Form 5500 regulatory filings. Axiomatic Social factors for public and private companies are used to identify socially responsible companies and can be used to create exclusion lists of companies with poor ESG rankings by sector and industry (IRS industry classification) for the social component of ESG. Academic research has shown Axiomatic “social” metrics are highly correlated with corporate performance proving the thesis: Companies that treat their employees well, function more effectively and outperform the market benchmark. Our database is available on an annual subscription basis. Clients receive a backfill of clean, historical, point- in-time data mapped to Russell 3000 tickers (available for testing) and then monthly updates. Price is dependent on use case(s) and AUM. Current customers pay between $30,000 and $100,000 per annum. We continue to work on creating derivative data (like our current ThriveScores) to provide a wider array of signals from the raw data. Our typical customer is a quantitative or quantimental asset manager, with a medium or long-term holding period for US equities. We also cover private US companies where customers range from marketers using our firmographic data to private equity funds using our data for deal sourcing and due diligence. Some of the Axiomatic Data ESG (Social) metrics gleaned from Form 5500 filings include:
- Salary Boost: the level and growth of employer contributions per active employee in a defined contribution pension plan, e.g., 401k plan.
- Salary Deferral: the level and growth of participant contributions per active employee in a defined contribution pension plan, e.g., 401k plan.
- Pension Plan Participation Rate: the percentage of employees participating in a defined contribution pension plan, e.g., 401k plan.
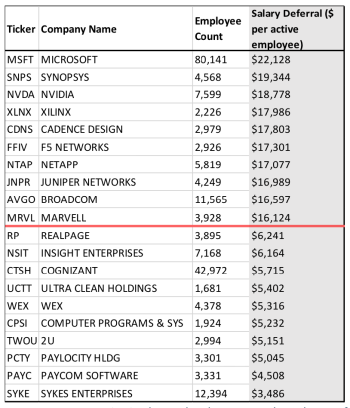
Case Study
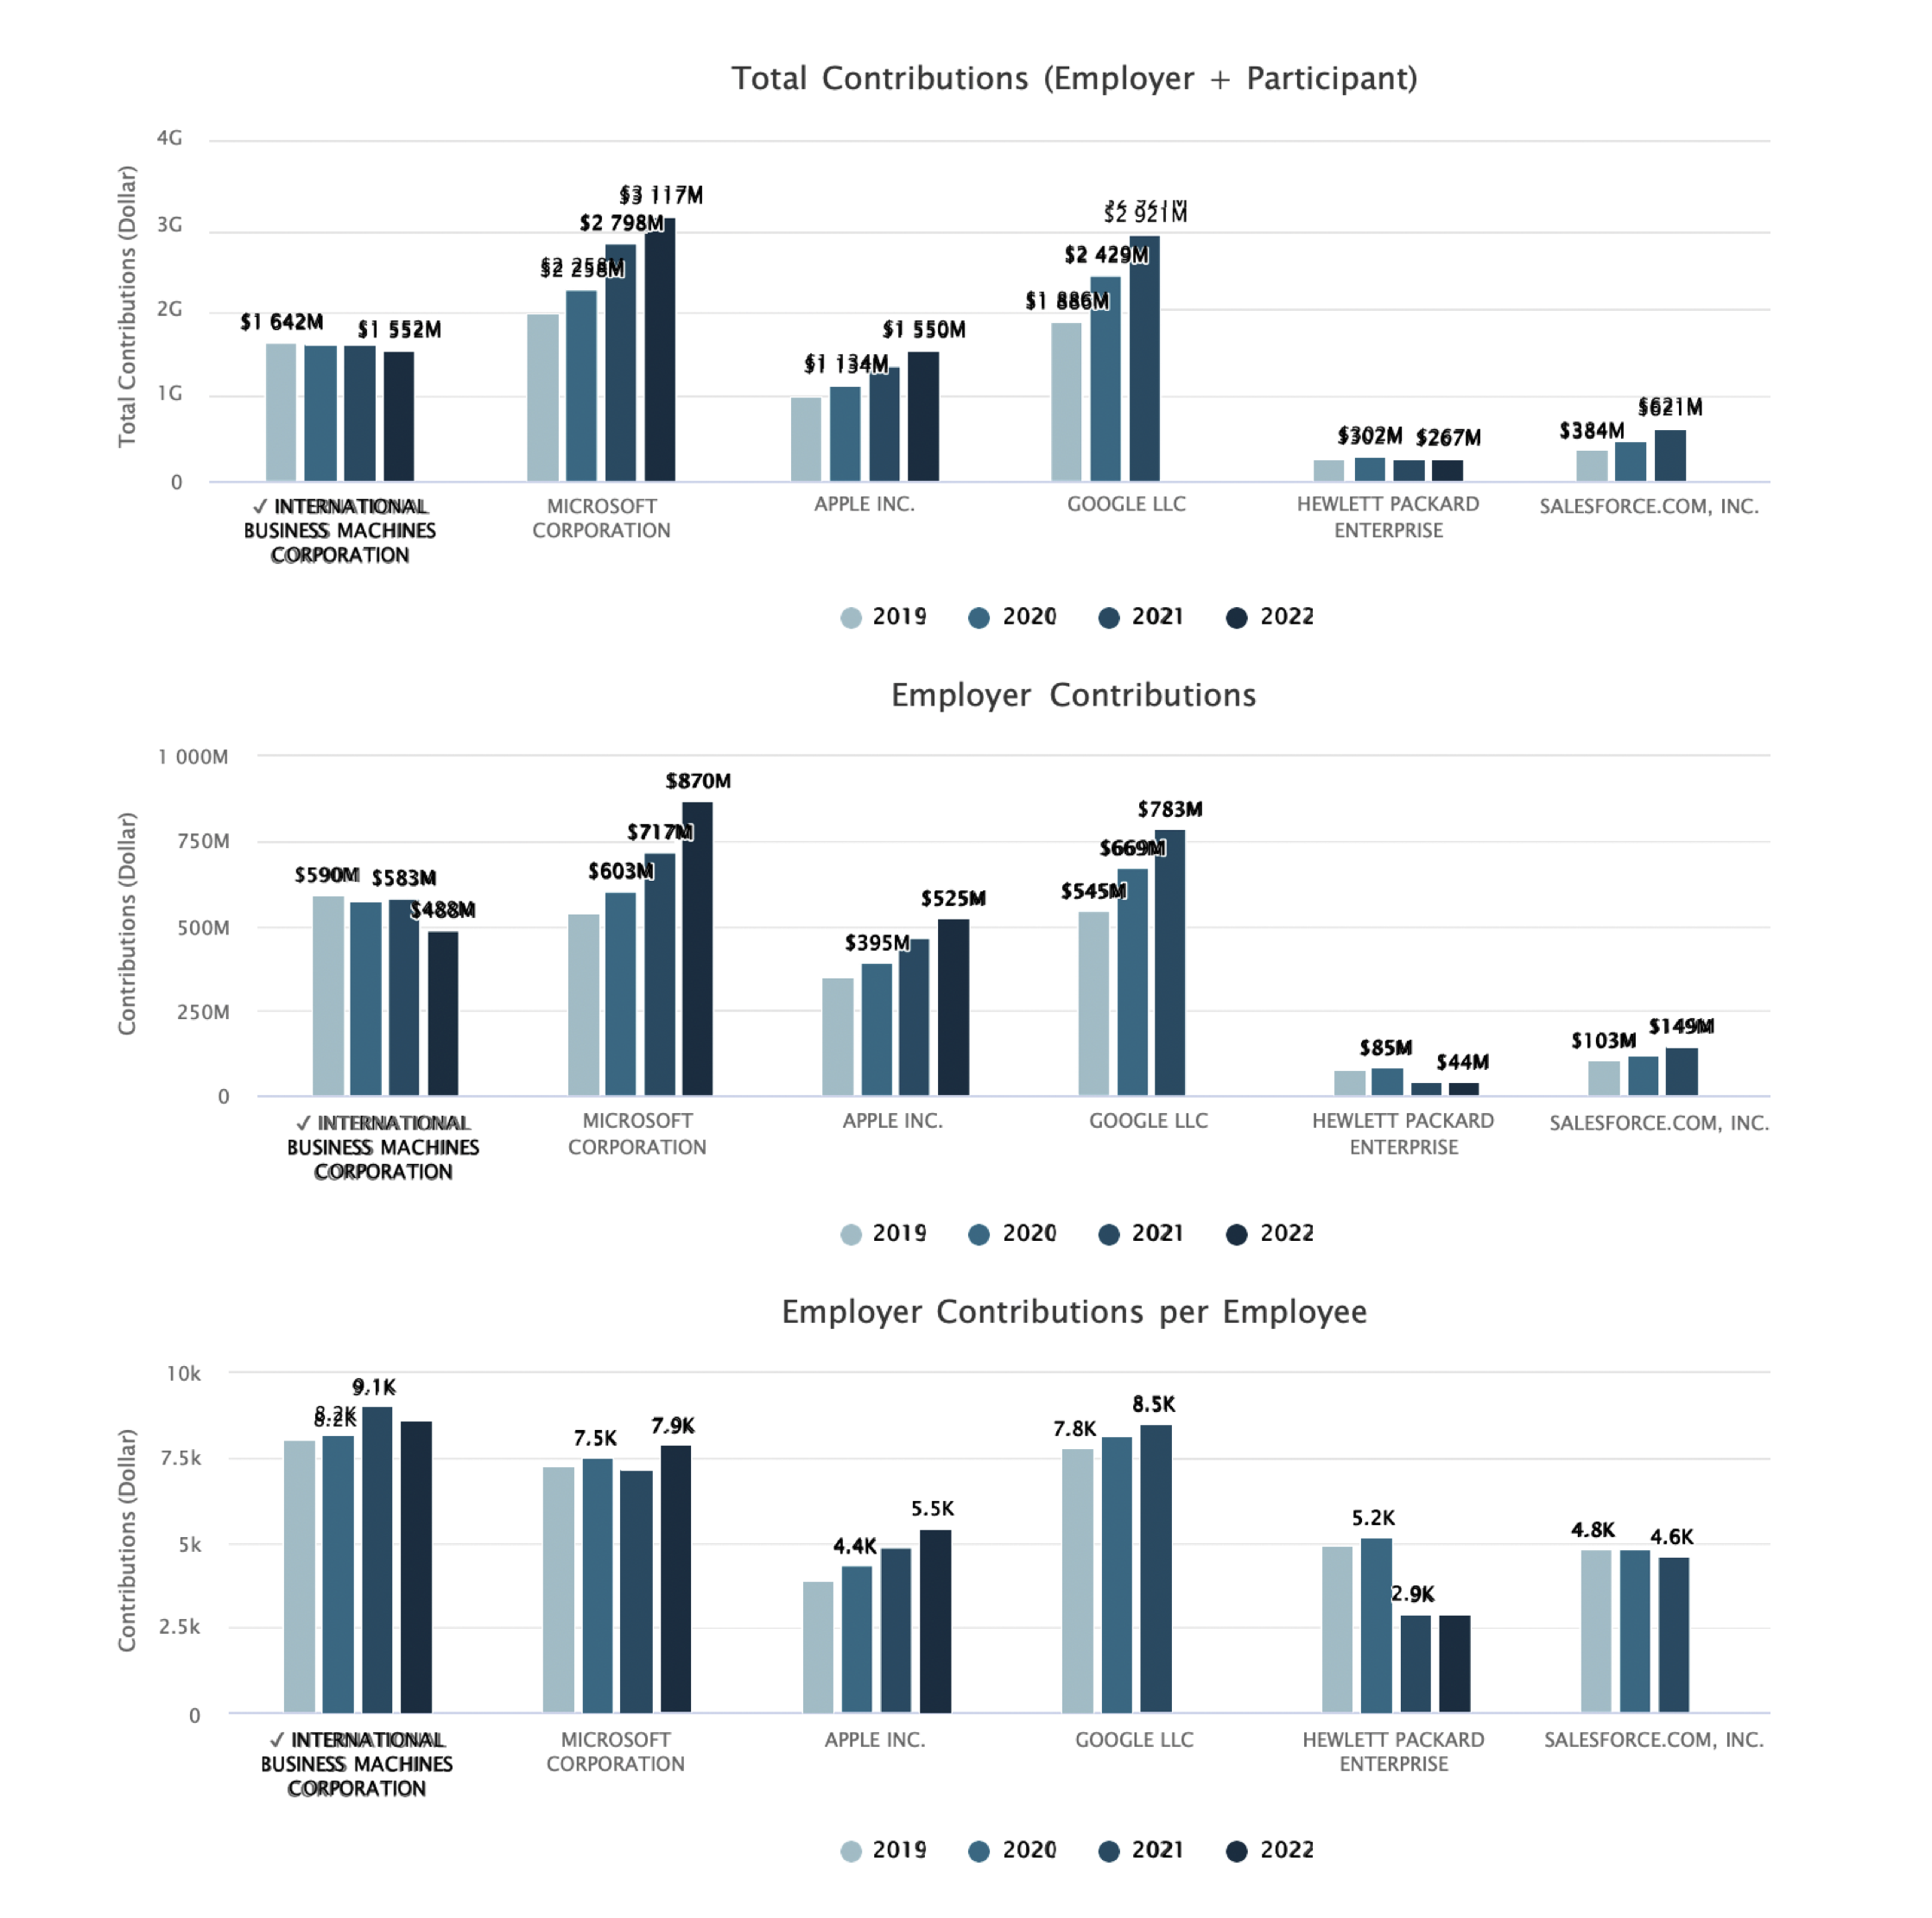
Using Axiomatic ESG Social metrics, we rank some of the highest-rated Technology companies. Most companies in this sector have high levels of Salary Deferral (participant contribution per active employee) and Pension Plan Participation Rates. This is expected, since these companies employ many white- collar, highly compensated workers with excess income to allocate to their 401k plans. However, even among these relatively homogenous companies there is a noticeable spread in Salary Boost (employer contribution per active employee) and employer contributions as a percentage of total contributions to defined contribution pension plans as seen in the figure below. The level and growth of company contributions per active employee have been found to be highly correlated with corporate performance.
Reconstitution of Russell Indexes 2022
http://axiomaticdata.com/blogPosts/reconstitution-of-russell-indexes-2022
Nearly 300 stocks were added to the Russell 3000 list during the Reconstitution process. Notable companies added to the Russell 3000 were Airbnb (ABNB), Coinbase (COIN), 23andMe (ME), Robinhood Markets (HOOD), Root Inc. (ROOT), and WeWork (WE). Conversely, nearly 300 stocks were dropped from the Russell 3000 list during the Reconstitution process. Notable companies removed from the Russell 3000 were Clovis Oncology (CLVS), Citizens Inc. (CIA), Red Robin Gourmet Burger (RRGB), Kirkland’s Inc. (KIRK), Mesa Air Group (MESA), and Metromile (MILE).
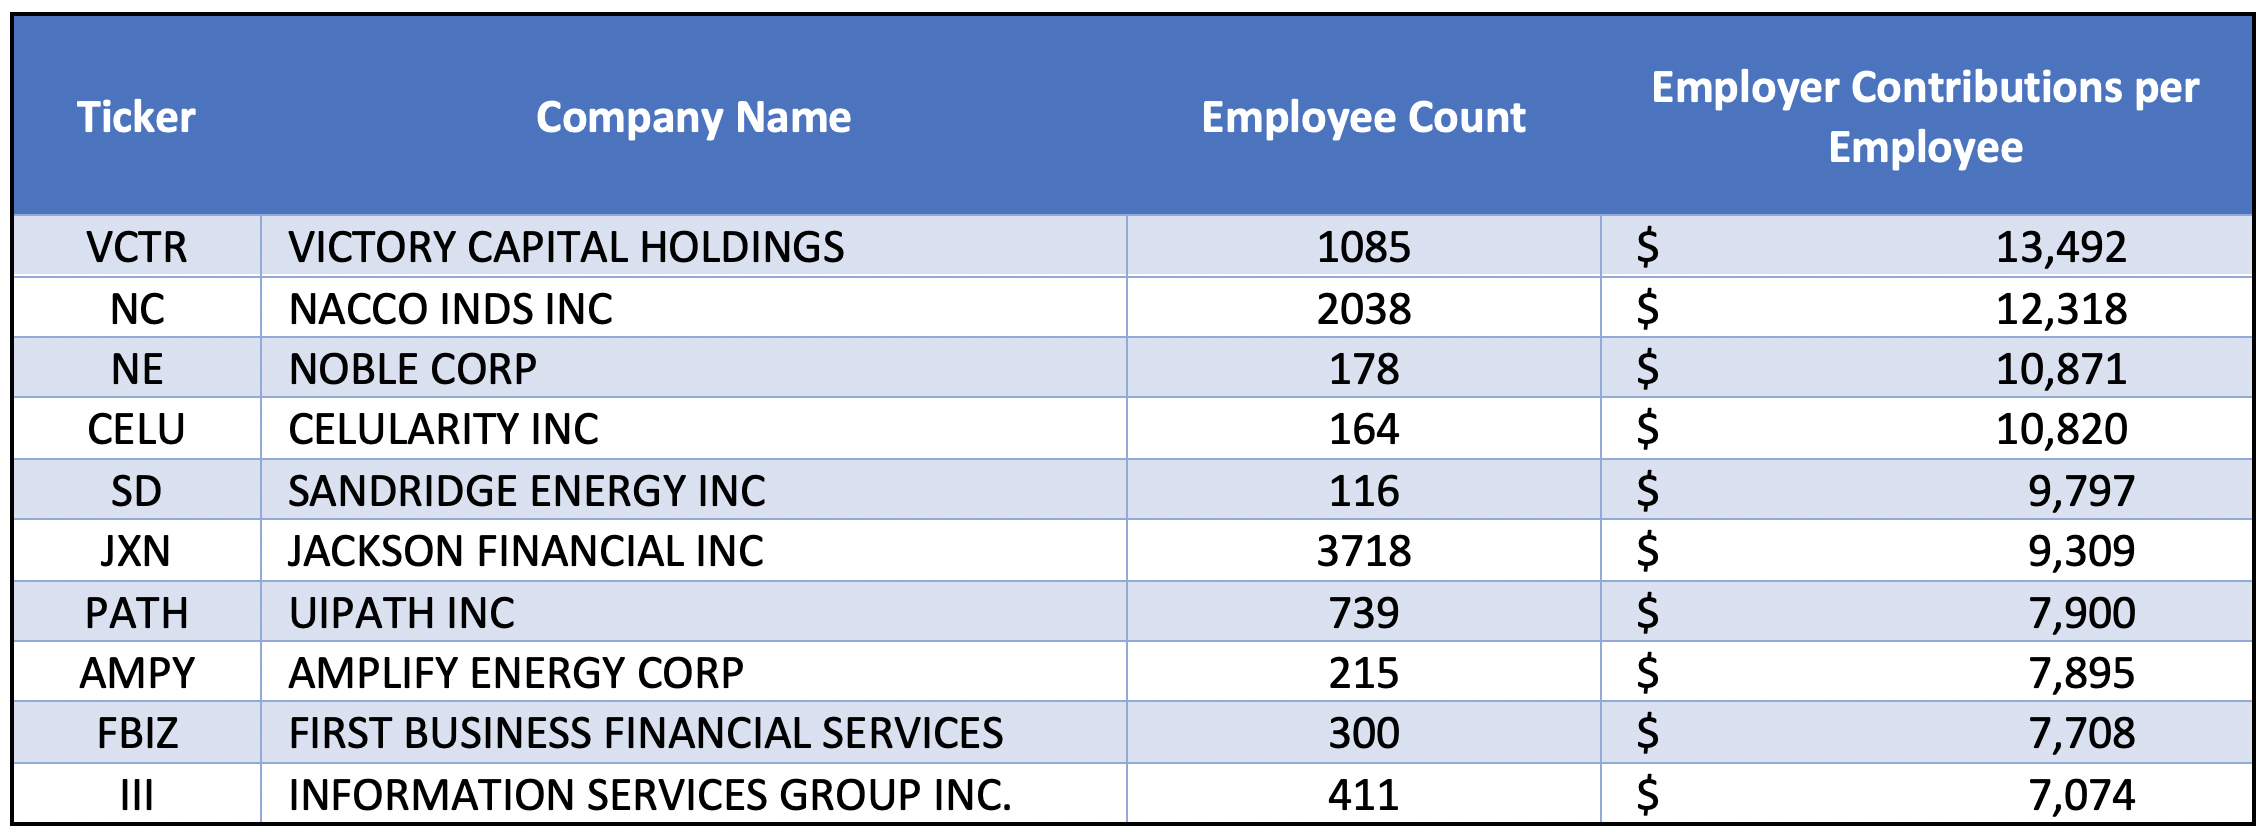
Examining the companies newly added to the Russell 3000 list, below is a table listing the companies with the highest pension contribution per employee. An earlier blog post detailed statistically significant correlations were found between contributions to defined contribution pension plans and corporate financial performance for Russell 3000 companies.
https://www.axiomaticdata.com/blogPosts/whitepaper-pension-contributions-and-finance-performance
About Axiomatic Data
The Axiomatic Data database contains quantitative data on public and private U.S. companies, extracted and aligned from Form 5500 (ERISA) filings. Form 5500 filings are mandated jointly by the U.S. Department of Labor and the Internal Revenue Service. The filings cover employee retirement and welfare benefit plans and are a required filing for all US companies that have over 100 employees or that offer their employees a pension plan. As part of Axiomatic Data’s monthly data runs, we match / map data from Form 5500 filings and associated EINs to the Russell 3000 tickers using our Russell 3000 base file and SEC 10-K filings. Additional data such as secondary name, EIN, and address are mapped from the 10-K filings to the Russell 3000 base file. With the annual Russell reconstitution in June, new tickers were added to the Russell 3000 as part of Axiomatic’s monthly data processes.
The database contains reliable, accurate firmographic and employee benefits information on over 700,000 US companies. Levels of, and changes to employer contributions to employee benefit plans are frequently used as a measure of financial health. It makes sense – companies that regularly increase the contributions they make to employee benefit plans must have the current and future cash flow to afford the contributions. Companies that decrease contributions to employee benefit plans would only do so if they were in, or expected to be, in financial distress.
Below is a link to a data sample of 100 stocks that were recently added to the Russell 3000 during the June reconstitution along with a sample dictionary.
https://www.axiomaticdata.com/samples/axiomatic_sample_100_new_russell3000_2022.xlsx
Additionally, further samples from Axiomatic Data can be found with the below link.
Contracting Industries - COVID Impact on Employment by Industry
http://axiomaticdata.com/blogPosts/contracting-industries---covid-impact-on-employment-by-industry
This is based on employee counts found in Form 5500 filings, which track all US companies that have either a qualified retirement plan or have 100 employees covered by a welfare or benefit plan. Not surprisingly, industries that heavily rely on people gathering were among the biggest losers of employees. Filings over the next few months should show which of these industries have bounced back.
New Company Formation By State 2020-2021
http://axiomaticdata.com/blogPosts/new-company-formation-by-state-2020-2021
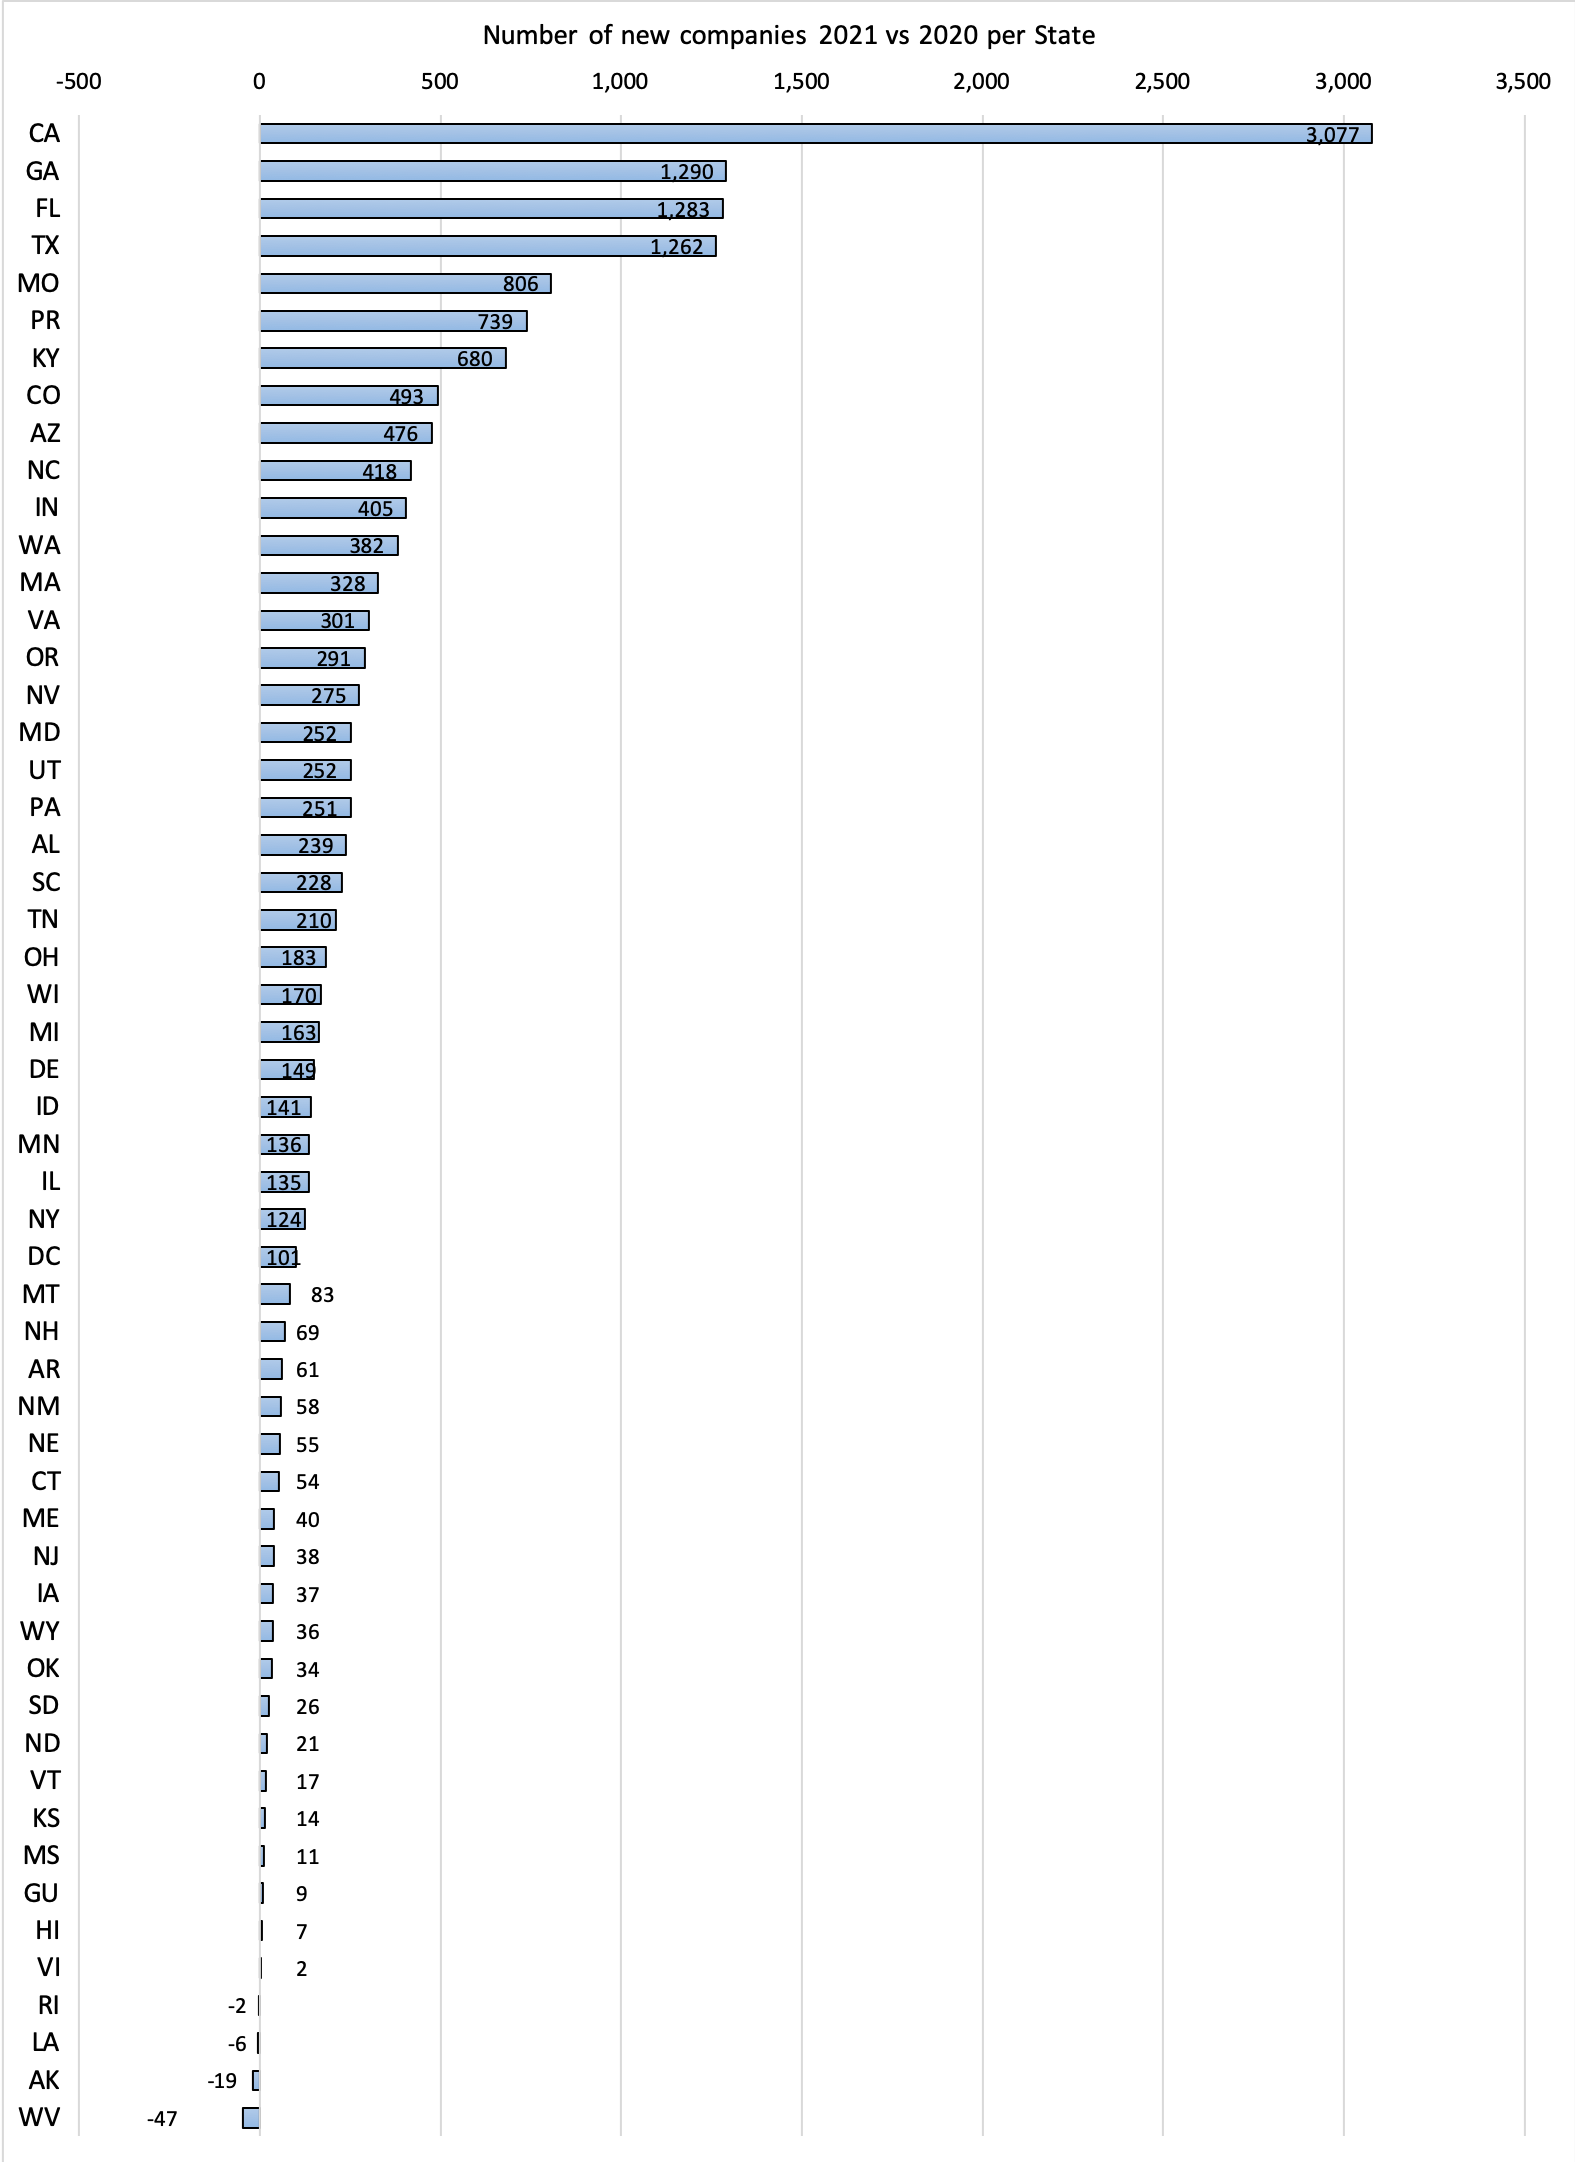
The chart below depicts new company formation by state between 2020 and 2021. California was far and away the leader in terms of new companies filing Form 5500s, either because they were brand new companies or because they grew to have an employee count requiring a health or welfare filing. One thing is clear - new companies are moving towards warmer weather as the leading states after California are Georgia, Florida, and Texas. Other southern states such as Mississippi, Louisiana, and Arkansas have poor school systems, and that could be a contributing factor to weak new company formation and company growth.
Form 5500 Filings Provide Data on the Social Component of ESG
http://axiomaticdata.com/blogPosts/form-5500-filings-provide-data-on-the-social-component-of-esg
Understanding how a company treats its employees is a key factor in the “Social” component of ESG. Form 5500 filings outline what benefits each company offers to its employees and allows you to determine which companies are most generous, and which companies are less generous.
Axiomatic Data’s Form 5500 database allows you to see changes in benefits over time and identify which companies in each industry are at the top of the employee benefit charts.
The Form 5500 Series is part of the Employee Retirement Income Security Act (ERISA) reporting and disclosure framework intended to ensure that employee benefits plans are operated and managed in accordance with prescribed standards. Further, it ensures that participants and beneficiaries, as well as regulators, have access to sufficient information to protect the rights and benefits of participants and beneficiaries under the covered employee benefits plans. All qualified retirement plans, 403(b) plans subject to ERISA, and health and welfare plans covering more than 100 participants are subject to filing the Form 5500, and filing must be done electronically by an officer of the company offering the plan.
An Overview of Axiomatic Data Private Company Data and Prospecting Uses
http://axiomaticdata.com/blogPosts/an-overview-of-axiomatic-data-private-company-data-and-prospecting-uses
Key Datapoints Available:
- Firmographic information (Company name, address, phone number, company age)
- Industry classification (Based on NAICS)
- Employee Counts
- Employee and Company pension contributions
- Employee growth rates, a proxy for overall growth of the company
- Pension plan net assets ($)
- Pension plan participation rate
Employment Data:
Employment counts sourced from Form 5500 data are considered to be the greater of the number of employees eligible for a pension plan or the number of employees participating in a welfare plan. As the data is sourced directly from Form 5500 filings which have specific requirements and definitions, the data is comparable across companies and industries. Further, as these filing requirements and definitions have been consistent over time, employment counts by company are available in a time series format which allows an analyst to understand growth trends for a company and its industry peers. Table 1 below depicts the distribution of private companies based on current employee count.
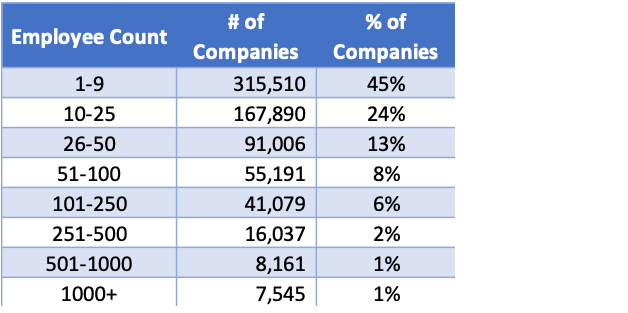
Table 1
Firmographic Data and Industry Classification:
Company name and address are sourced directly from the Form 5500 filings submitted by the companies themselves, ensuring superb quality and accuracy. Additionally, companies self-select their industry classification from a NAICS-based classification. This NAICS classification contains more than 420 industries, 97 industry sub-sectors, and 21 industry sectors. Table 2 below shows the distribution of companies by industry sector.
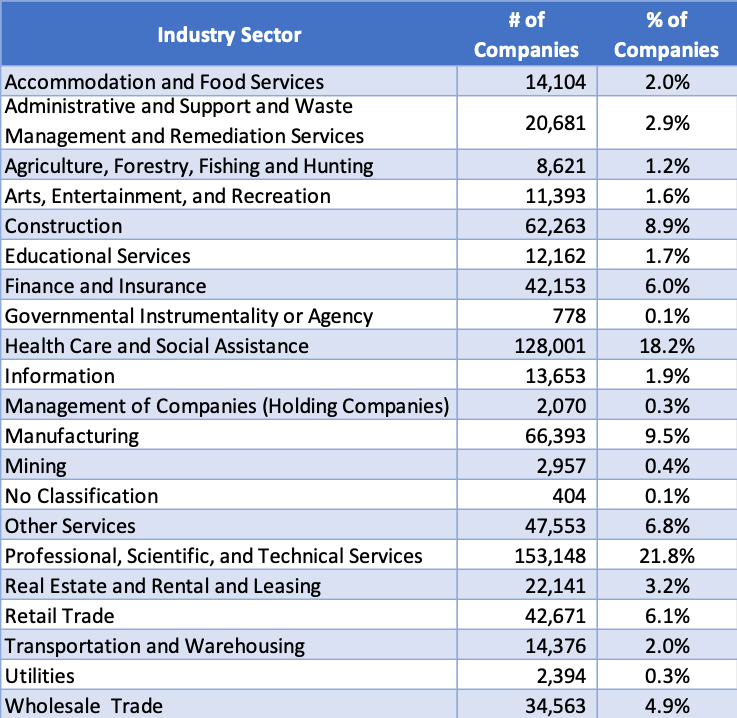
Table 2
Time Series Data
As Form 5500 is a required annual filing that has required consistent data with consistent definitions over time, Axiomatic Data has the advantage of providing consistent longitudinal and time series data. An example of this time-series data is included below. This allows for the computation of accurate growth rates which is a rarity for private company data. An example of this time series data is shown in Table 3 below.
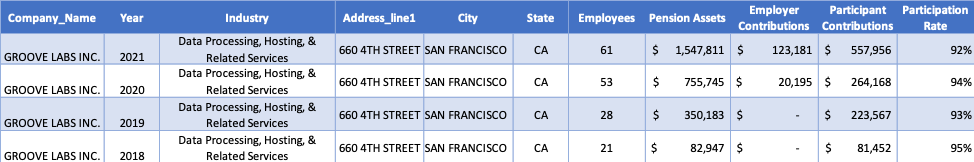
Table 3
Growth Metrics:
Having consistently defined time series data allows for accurate growth rate variables. Particularly useful are Axiomatic Data’s one and three year growth rates of employment which are an overall proxy for the growth trajectory of a company. These growth rate variables allow for the identification of fast-growing companies for either customer targeting or company acquisition. Table 4 below provides a distribution of companies with decreasing employee count, no change in employee count, and increased employee count over one and three year time periods.
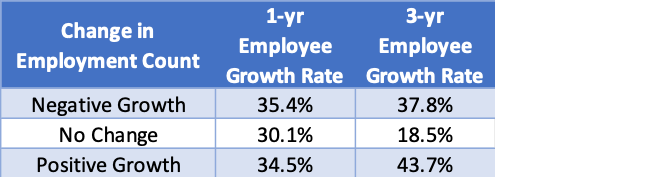
Table 4
Axiomatic Data Potential Use Cases:
- Customer or Acquisition Prospecting
- Identify emerging and growing companies using consistent growth metrics
- Identify companies in specific industries and/or specific geographic areas
- 401K Prospecting for financial advisors/financial advising firms
- Identify prospects in region with large amounts of $ in pension plans
- Company Due Diligence
- Company Benchmarking
Data Sample and Dictionary
Data samples with a corresponding data dictionary can be located here for companies in the states of South Dakota and Rhode Island.
About Axiomatic Data
Axiomatic Data, the Form 5500 Information Company, provides a database and analytic tools for US public and private companies based on Form 5500 filings. The database has history back to 2013 and for the Russell 3000 is point-in-time and mapped to tickers. In addition to using Axiomatic Data as part of financial models for US public company investing, Axiomatic Data is used for ESG analysis, private equity deal sourcing and due diligence, and for comprehensive firmographic information for US companies.
Prepaid Legal Plans in Form 5500 Data
http://axiomaticdata.com/blogPosts/prepaid-legal-plans-in-form-5500-data
What are prepaid legal plans?
Prepaid legal plans are a benefit offered by employers that has become more popular over the past 10 years. Prepaid legal plans operate similar to a legal insurance plan. For a small monthly or per paycheck fee, a plan member can prepay for legal services that may be needed in the future. A prepaid legal plan is a contract wherein the legal provider agrees to provide certain legal services through a network of attorneys.
Prepaid Legal Plans have grown in popularity.
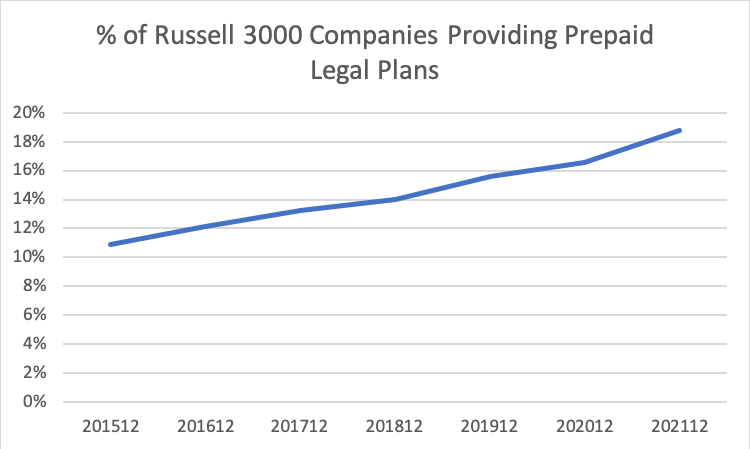
As seen in the figure below, the number of Russell 3000 companies offering prepaid legal plans has increased steadily over the past 6 years. In 2015, only 11% of Russell 3000 companies offered a prepaid legal plan, and this has grown to over 19% in 2021. These prepaid legal plans are becoming a more popular benefit as they are a benefit that employers can provide at either low or no-cost to the employer. The employer can “sponsor” the plan, but may not pay any of the premiums for the employees themselves.
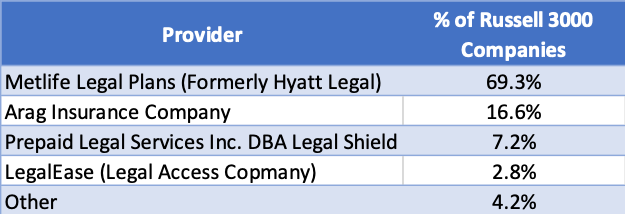
A Majority of Russell 3000 Companies use MetLife for their Prepaid Legal Plans.
As seen in the table, of those Russell 3000 companies indicating they have a prepaid legal plan, nearly 70% have an insurance contract with MetLife. Comparing the size of the insurance contracts among the 3 largest providers, Arag Insurance Company has the highest median count of persons covered per insurance contract. Prepaid Legal Services Inc. DBA Legal Shield has the lowest median count of persons covered per insurance contract which is not surprising given that Legal Shield focuses on small and medium businesses.
Axiomatic Data Form 5500 Prepaid Legal Data.
Download here a sample of Axiomatic Data Prepaid Legal data. Key fields include company name along with address, insurance provider name, count of members covered by insurance contract, start and end date of the policy contract, and price of the insurance contract.
Use Cases:
- Prospecting for insurance carriers.
- Competitive information for HR.
- ESG (Know which companies offer their employees certain benefits).
About Axiomatic Data:
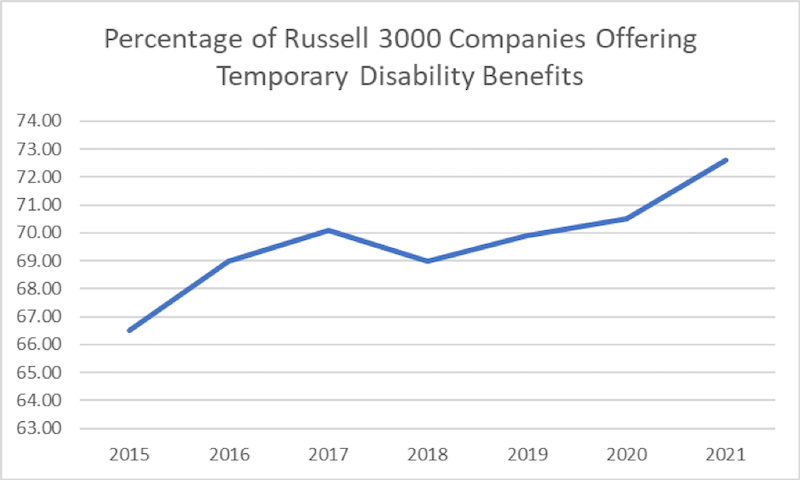
Axiomatic Data extracts and aligns data from IRS Form 5500 (ERISA) filings, which cover retirement and welfare benefit plans. In Form 5500 filings, the plan sponsor must provide information about each insurance contract that is used. Key insurance contract information includes: Insurance carrier name, number of persons covered by contract, and broker name along with commission paid. While this post looks at Prepaid Legal, similar information can be found for Health, Dental, Life Insurance, Vision, Temporary Disability, Long-term Disability, Death Benefits plans.
Form 5500 Filings: 2021 in Review
http://axiomaticdata.com/blogPosts/form-5500-filings--2021-in-review
Axiomatic Data aggregates Form 5500 filings and extracts, cleans, and harmonizes the data for use by quantitative investors, private equity funds, and other businesses that need employee and firmographic information on US companies.
Who must file a Form 5500?
Any US company, regardless of size, that has an employee retirement plan, or If on the first day of their ERISA plan year a company has 100 or more participants enrolled in coverage, then they will need to file a Form 5500 for their Health and Welfare Benefit plan.
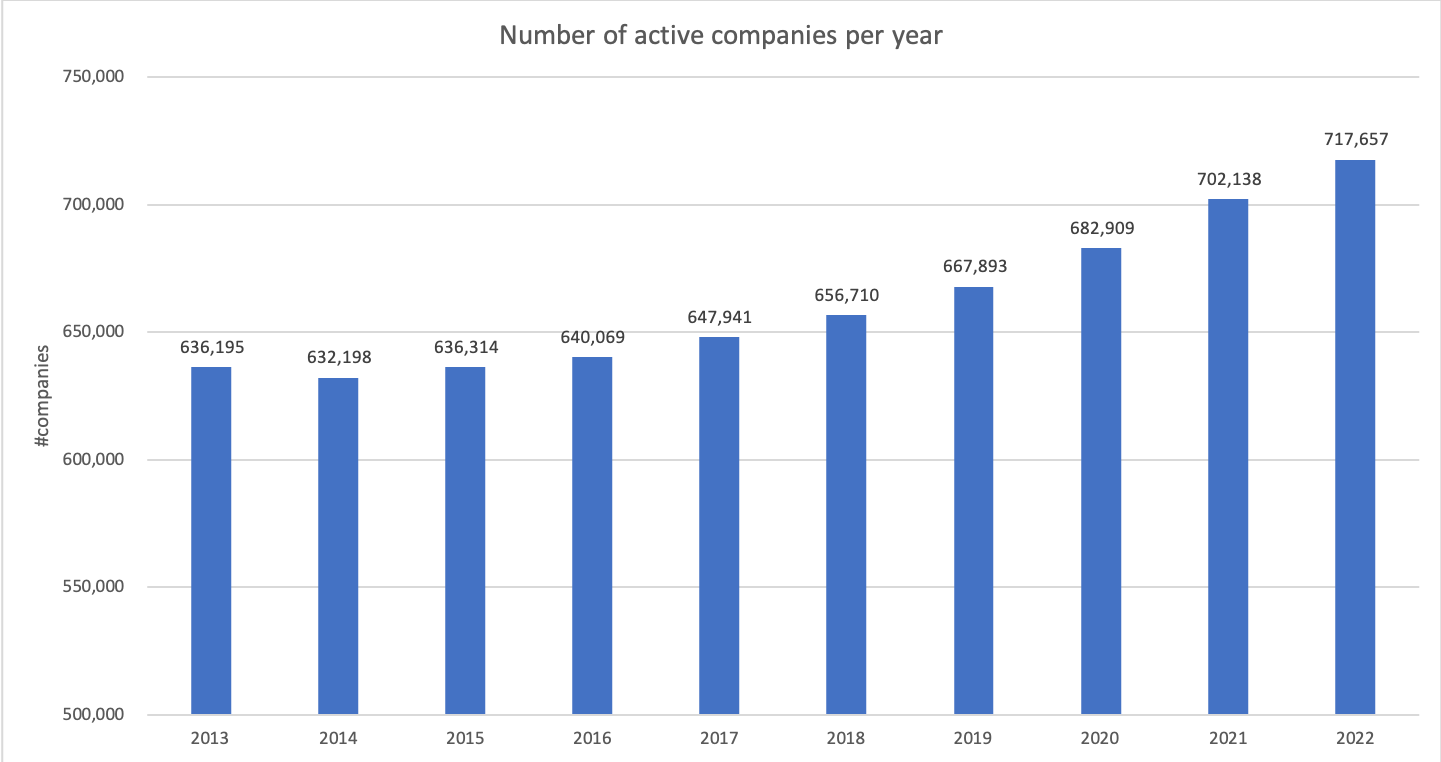
The table below shows the continued uptrend in active companies filing a Form 5500 from 2013 to 2022. So despite COVID-19, active company growth persisted in 2020 and 2021.
The number of employees enrolled in plans that need to file a Form 5500 actually decreased slightly in 2021. This is likely the result of a combination of factors, from hospitality companies laying off or furloughing workers, to the “great resignation”. At the same time, the “great resignation probably contributed to the expansion in the number of active companies.
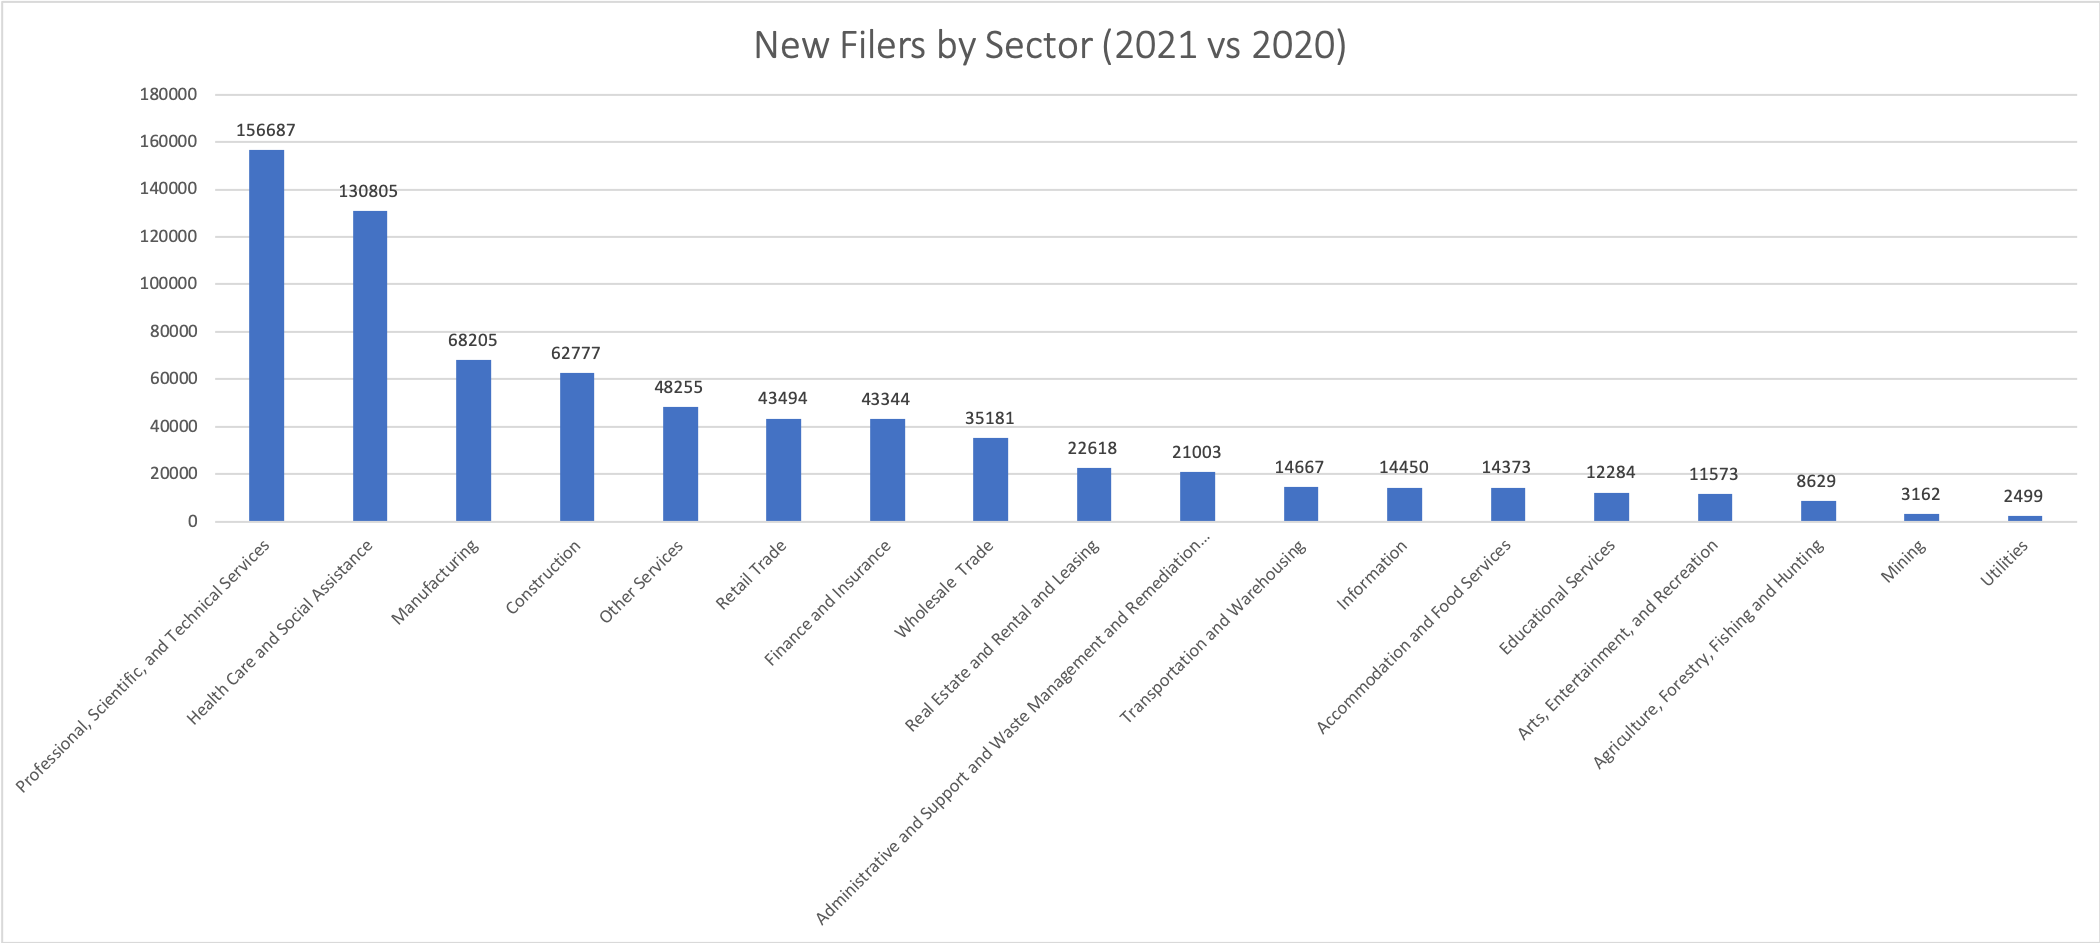
Filers of Form 5500s must indicate the industry group their company is part of, selecting from a list of industries constructed by the IRS. The chart below shows shifts in employees by industry from 2020 to 2021.
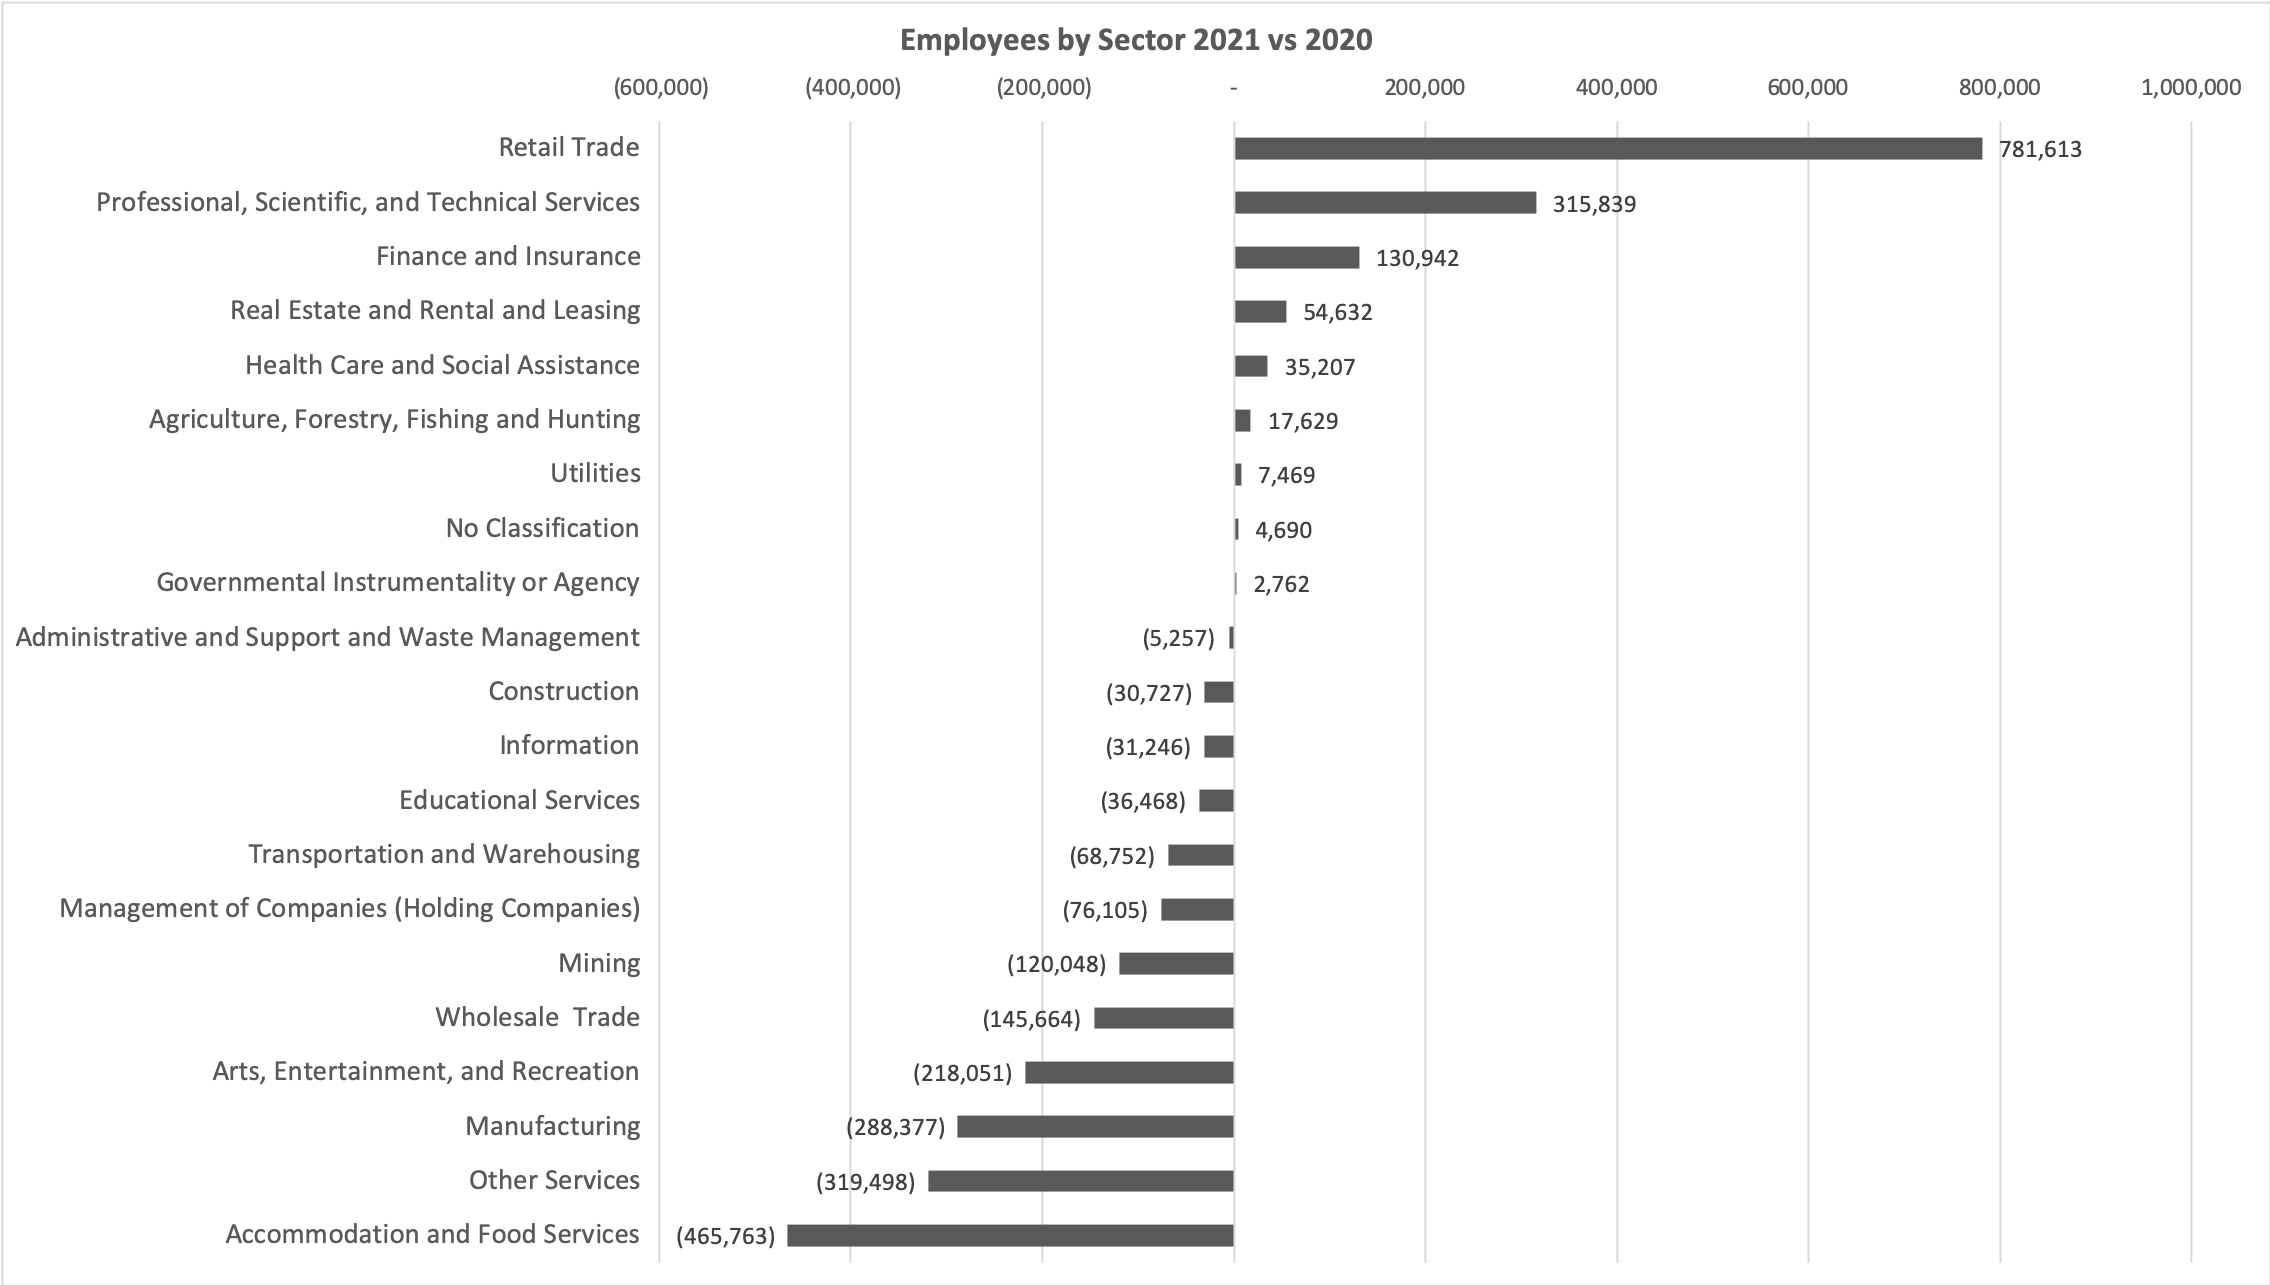
Professional, Scientific, and Technical Services was the leading sector for new filers by a wide margin.
There’s a tremendous amount of information locked in Form 5500 filings that Axiomatic Data prepares for analysis. Next post will describe some benefit-specific information available in the Form 5500 series.
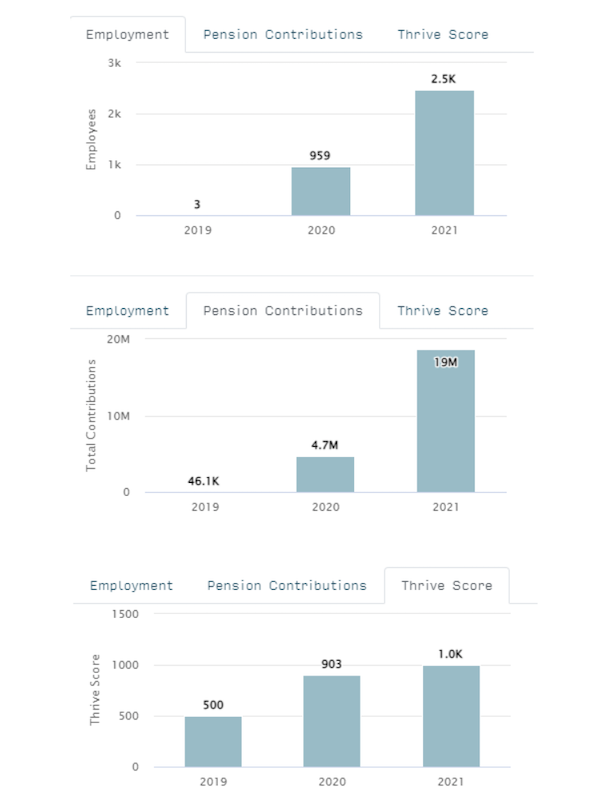
Perfect Scores - Awaiting a Comeback
http://axiomaticdata.com/blogPosts/perfect_scores_-_awaiting_a_comeback
ThriveScores range between 0 and 1000 and a high ThriveScore usually points to strong stock market performance. It’s rare that a company will have a score of 1000, but several companies have achieved this. The factors that contribute most heavily are employee growth and growth in employer contributions to employee pension plans. At the end of 2021 only 10 companies in the Russell 3000 had ThriveScores of 1000.
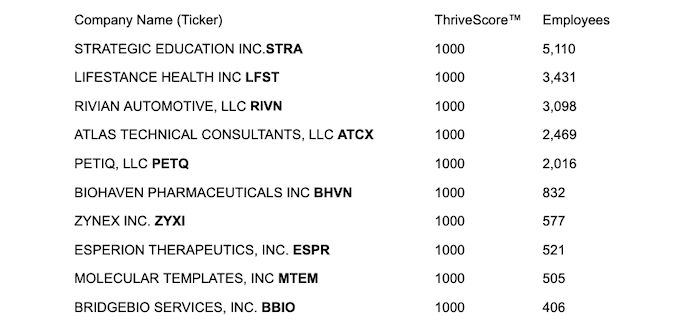
None of these companies have been immune to the recent market downturn, but if the historical relationship between ThriveScores and market performance remains, these companies are strong bets going forward. ATCX had a noticeable bounce recently. Note the increase in pension contributions between 2020 and 2021.
Axiomatic Data Creates and Releases ESG Social Metrics
http://axiomaticdata.com/blogPosts/axiomatic-data-creates-and-releases-esg-social-metrics
There are many sources of information that measure the Environmental and Governance aspects of ESG. Working with ESG-sensitive investment managers, we created three metrics that facilitate comparisons between companies based on how they treat their employees, which is a critical part of the “Social” component in ESG.
Salary Boost measures the level and growth of company contributions to a retirement benefit plan. Salary Deferral measures the level and growth of participant contributions to a retirement benefit plan. Pension Plan Participation Rate measures the level of participation among employees in a company-sponsored retirement plan. These metrics will vary widely between industry groups, but within industry groups these metrics can identify the strongest and weakest “S” performers.
Complete Paper can be downloaded here
Predicting Company Performance With Company Benefit Plans
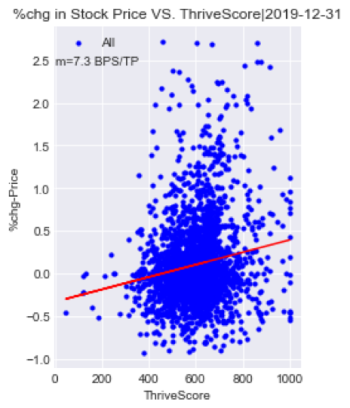
http://axiomaticdata.com/blogPosts/predicting-company-performance-with-company-benefit-plans
Leveraging Axiomatic data's capability to track these filings in real time, Alan Kwan shows that simple indicators of company growth derived from benefit plans predict company stock returns. The returns to this strategy exceed compensation for market risk. Companies scoring well on employee benefits outperform especially well during the Covid 19 pandemic.
Complete Paper can be downloaded here
Axiomatic Data Creates and Releases ThriveScores™
http://axiomaticdata.com/blogPosts/Axiomatic-Data-Creates-and-Releases-ThriveScores
New York, NY February 11, 2021 - Axiomatic Data, the Form 5500 Information Company, announced today the creation and release of ThriveScores™ to its database covering over 650,000 US public and private companies. Using information extracted from Form 5500 filings, Axiomatic Data has developed a scoring methodology that predicts corporate growth, or likelihood to thrive, across the vast majority of US companies. ThriveScores can be used as a measure of financial health for all US companies and as an investment signal for US public companies.
The Form 5500 series is a compliance, research, and disclosure tool for US employee benefit plans. The Department of Labor has mandated that a Form 5500 must be filed for welfare benefit plans by companies with over 100 employees and for all retirement plans such as 401Ks. Axiomatic Data aggregates, harmonizes, and normalizes several million Form 5500 filings annually to create an accurate, robust database serving multiple use cases.
“Customers asked if we could make stock price performance and financial health predictions based upon changes in employment and corporate benefits reported in Form 5500 filings. ThriveScores do just that,” said Steve Goldstein, a partner at Axiomatic Data. “We’ve developed algorithms that capsulize these changes and deliver this information in ThriveScores.”
“We analyzed the last 4 years of Axiomatic Data’s ThriveScores and found that Russell 3000 companies with higher ThriveScores outperform companies with lower ThriveScores,” said Larry Green, President of SmartMarketData, LLC, an alternative data analytics firm. “The data was compelling, and we’ve published a white paper that summarizes our findings.”
The ThriveScores algorithms incorporate changes in employment and employer contributions to employee benefit plans, among other attributes, from Form 5500. The SmartMarketData white paper can be downloaded here.
Reconstitution of Russell Indices 2020
http://axiomaticdata.com/blogPosts/reconstitution-of-russell-indices-2020
Key Findings:
While technology companies dominated the large-cap index, the highest percentage of new entrants in Russell 3000 in 2020 belonged primarily to the Professional and Scientific.
On the other hand, not surprisingly (post COVID-19), there were five companies belonging to the Accommodation and Food Services industry that exited the Russell 3000, but none within that industry entered the Russell.
Companies exiting the Russell were more likely to have a legacy defined-benefit plan, leading to additional financial pressue on these bigger companies wih under-funded defined benefit plans (see this post).
Axiomatic Data Announces the Launch of Finder
http://axiomaticdata.com/blogPosts/axiomatic-data-announces-the-launch-of-finder
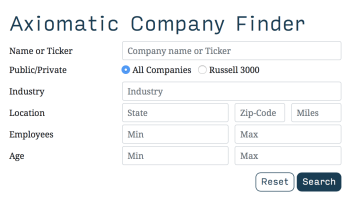
Key Features:
- Search across over 700,000 public and private US companies.
- Compare companies across key employee benefit metrics.
- Graph comparisons on screen.
- Download data for further analysis.
Download the full press release here.
Pension Contributions & Financial Performance
http://axiomaticdata.com/blogPosts/whitepaper-pension-contributions-and-finance-performance
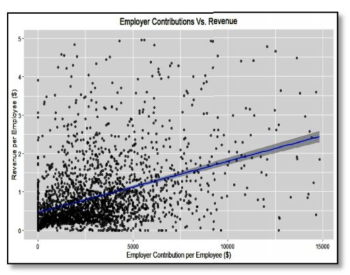
Key Findings:
Statistically significant correlations were found between contributions to defined contribution pension plans and corporate financial performance for Russell 3000 companies.
Employer contributions were found to be more correlated with financial performance than participant contributions, consistent with findings from a research paper by T. Rowe Price.
Companies with higher contributions per employee were found to be more likely to have higher revenue and EBITDA per employee, accounting for company size, age, and industry.
Above findings were found to hold for all industry sectors, except Professional, Scientific and Technical Services, which has little correlation between EBITDA and pension contributions per employee.
COVID-19 effect on defined benefit plans
http://axiomaticdata.com/blogPosts/covid-19-effect-on-defined-benefit-plans

Key Findings:
Current economic downturn and likely cut in stock dividends caused by the COVID-19 pandemic could lead to financial pressure on companies with under-funded defined-benefit plans.
Approximately 27% of companies in the Russell 3000 still have a defined-benefit pension plan.
Companies with a high target normal cost and a high concentration of active defined-benefit
plan participants will have additional liability in the form of future company contributions.
Companies in the air transportation and retail industries that are historically vulnerable to plan failures and low funding ratios have a more significant problem during the current market downurn with “at-risk” underfunded defined-benefit plans.