Comparison of 2021 and 2022 Company Data from Form 5500 Data
Number of Active Companies
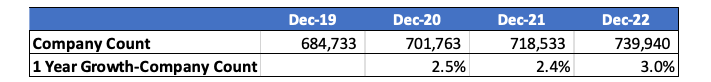
Below is a table displaying the number of active companies by year for the last four years. The most recent year has a slightly higher growth rate which may be indicative of a return of business activity post Pandemic.
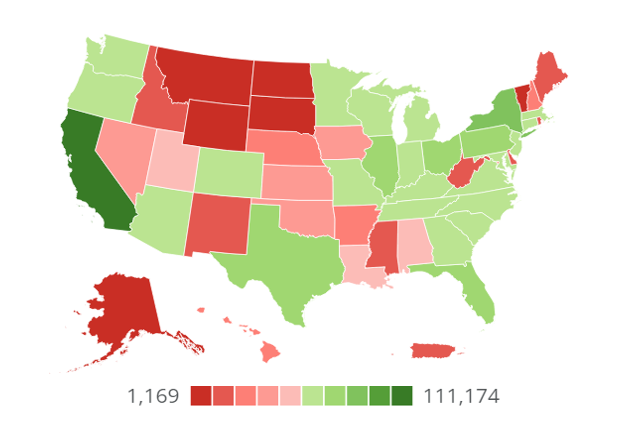
As Form 5500 data provides valuable firmographics such as official company name, address, industry classification, etc., we are able to compare changes across these metrics over time. Filing a Form 5500 itself is a signal of financial strength and stability compared to companies that do not file Form 5500s. While there are strong and profitable companies that may never file a Form 5500, setting up an employer sponsored retirement plan covered under ERISA is a sign of strength as setting up a plan is a nontrivial commitment. Below is a chart depicting the distribution of companies across the United States. Not surprising, California has the most companies with over 111,000.
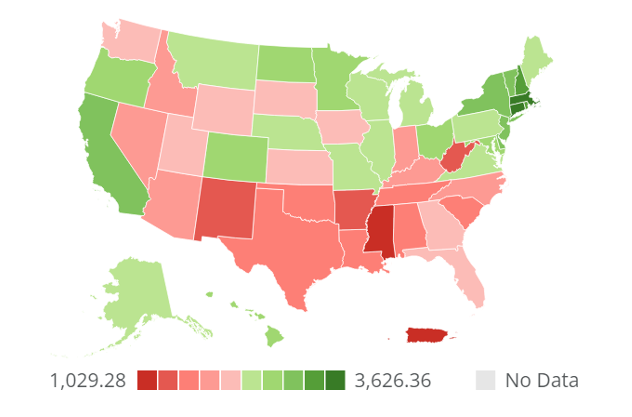
Examining the same chart but on a per-capita-basis (# of companies per 1M residents), we notice a high distribution of companies per state resident in the Northeast U.S., while the Southeast has a lower distribution per capita. Particularly, Massachusetts has the highest number of companies with 3626 companies per 1M residents, while Mississippi has the lowest number of companies per capita, 1029, which is more than 3.5X lower than Massachusetts.
U.S. County Comparison
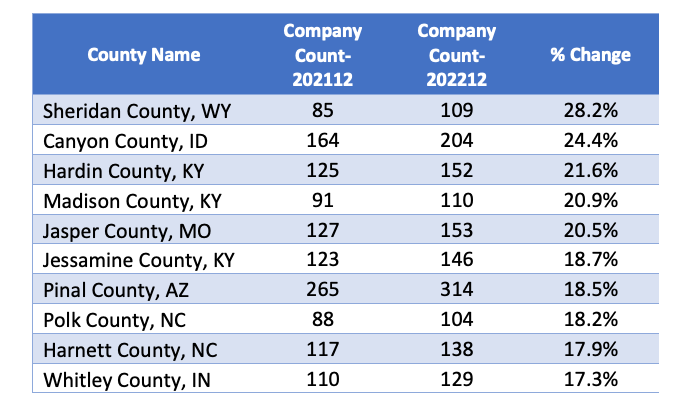
Below is a table comparing counties with the largest % increase in companies from December 2021 to December 2022. This table only includes counties with more than 100 active companies in the Axiomatic Data database. These increases can be a sign of economic strength in the region. It is noteworthy that Kentucky had three of the counties within the top ten for company growth rate.
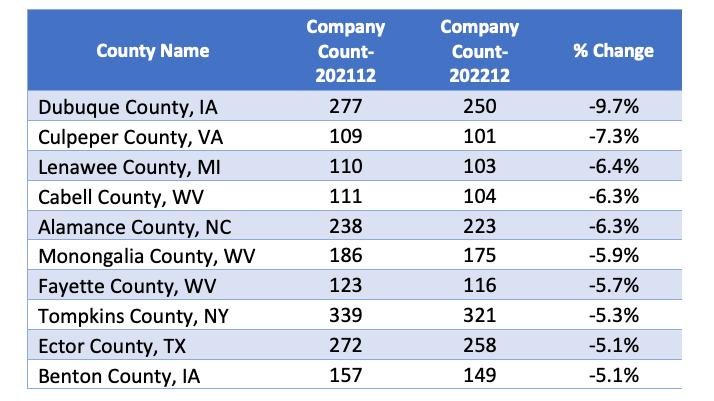
On the other hand, the chart below lists counties with the largest % decrease in companies from 202112 to 202212. Overall, Dubuque County had the largest drop of nearly 10%. The state of West Virginia had three of the top ten counties on the list indicating signs of potential economic weakness in the area.
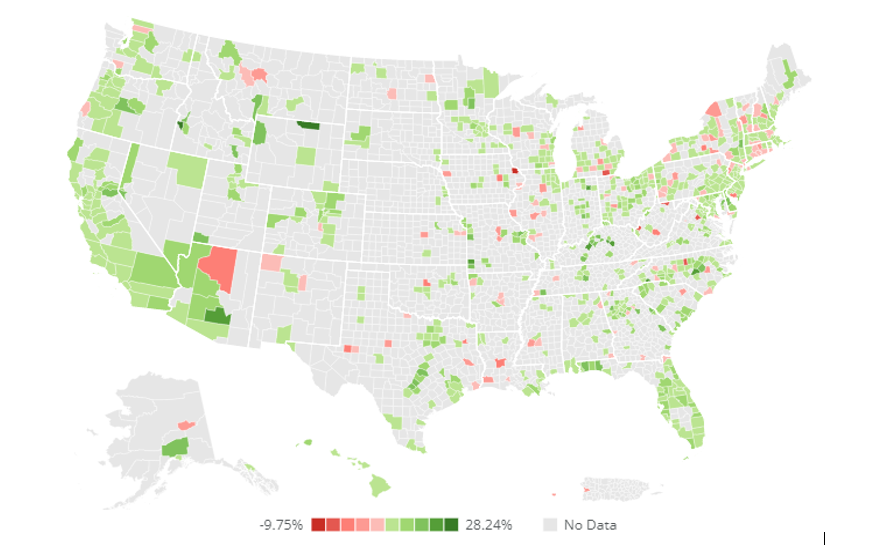
The map of the U.S. below shows company growth rates by U.S. county for all counties in the U.S. with more than 100 companies in the Axiomatic Data database.
Data sample: Please visit https://www.axiomaticdata.com/samples/ for a data sample along with data dictionary. Select the “Private Company Prospecting Sample” for either Rhode Island or South Dakota.
Download as PDF: Axiomatic Data Year Over Year Comparison Company Count